. 2024 Nov 30;13(11):6364-6380.
doi: 10.21037/tcr-2024-2195. Epub 2024 Nov 27.

N-acetyltransferase 10 as a novel prognostic biomarker in papillary renal cell carcinoma: a machine learning and experimental validation study

Affiliations

N-acetyltransferase 10 as a novel prognostic biomarker in papillary renal cell carcinoma: a machine learning and experimental validation study

Liyang Li et al. Transl Cancer Res. .

Abstract

Background: N-acetyltransferase 10 (NAT10) is a lysine acetyltransferase known for catalyzing the N4-acetylcytidine (ac4C) modifications on RNAs. Recent studies have associated NAT10 with the pathogenesis of various cancers. However, its specific function and prognostic significance in papillary renal cell carcinoma (pRCC) remain poorly understood. This study aimed to explore NAT10's prognostic value and mechanisms in pRCC.

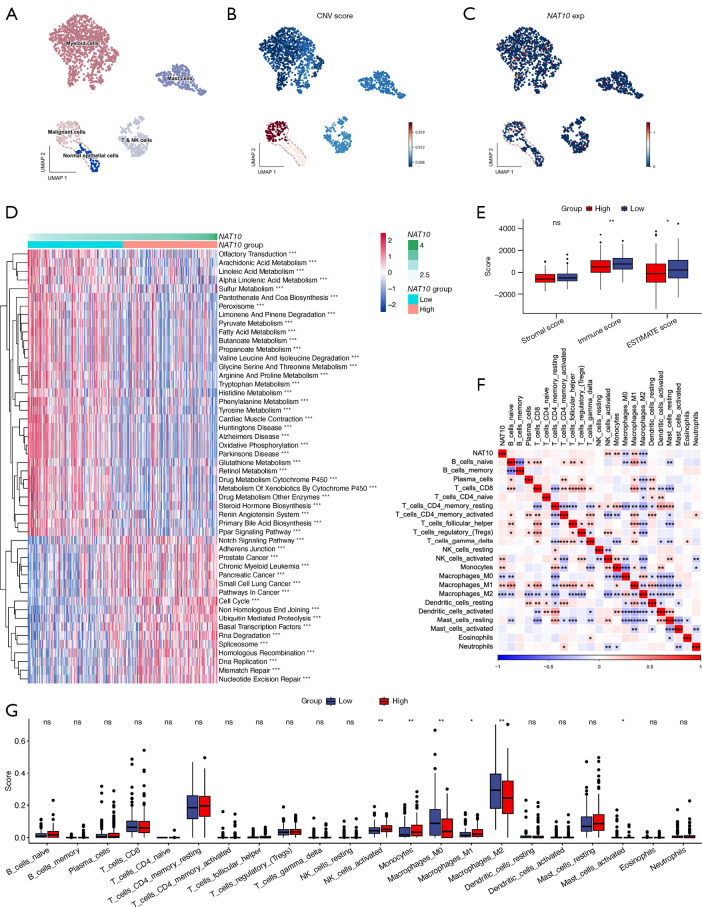
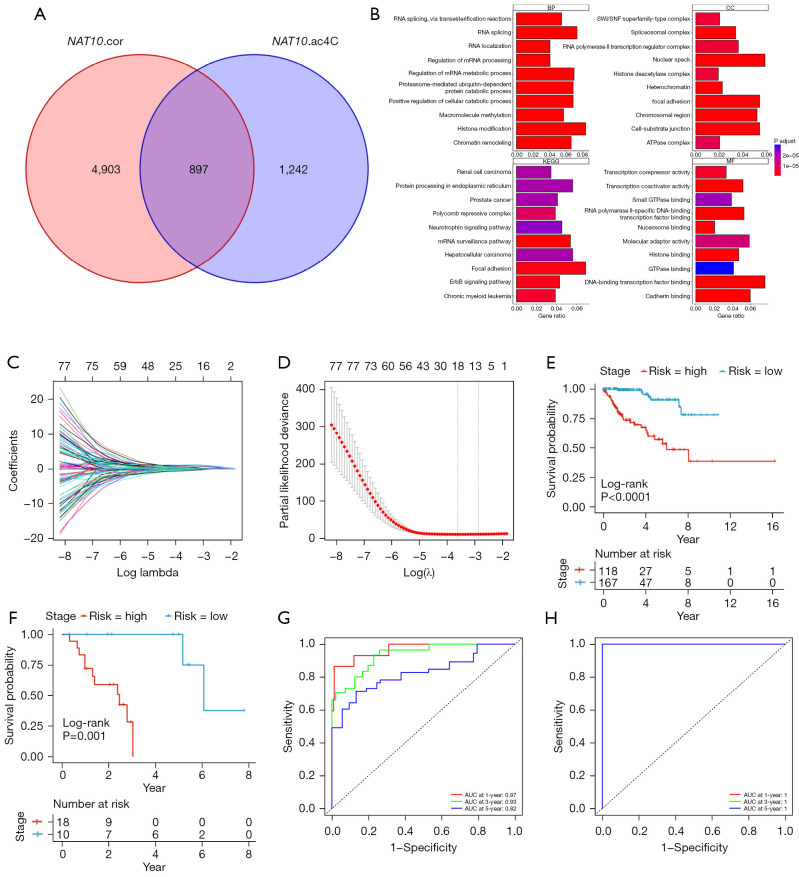
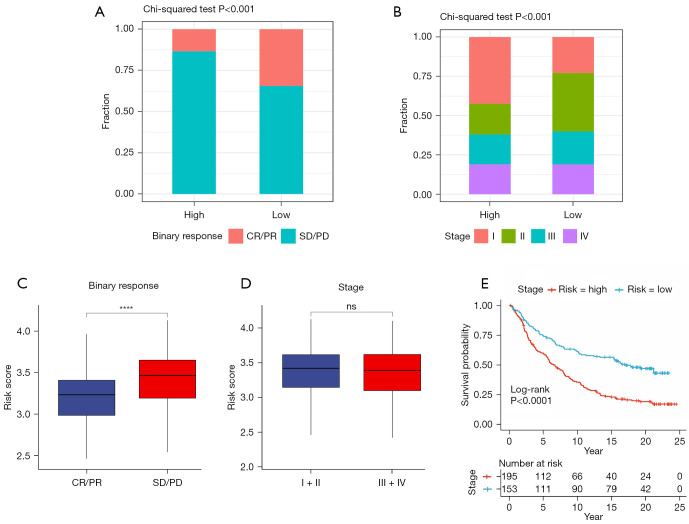
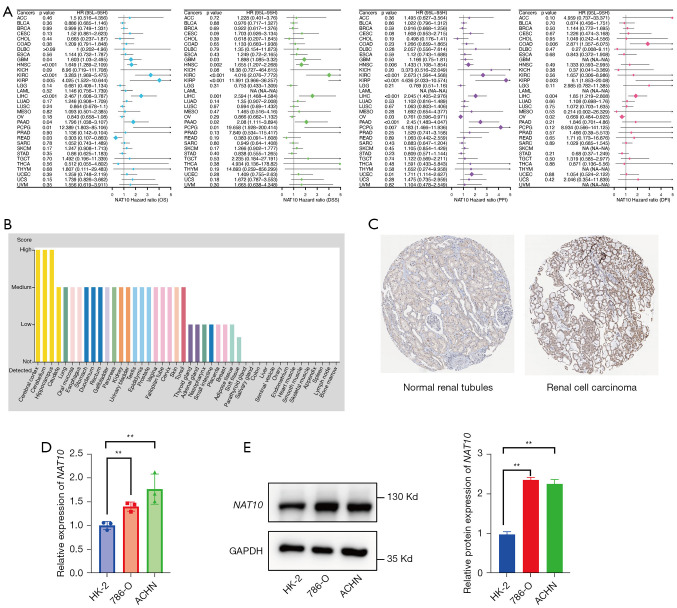
Methods: NAT10 expression and prognostic associations in pancancer were analyzed using The Cancer Genome Atlas (TCGA). Single-cell RNA (scRNA) sequencing data from a previous study were used to characterize NAT10 expression at the single-cell level in pRCC. Pathway enrichment analysis, including gene set variance analysis (GSVA) and overrepresentation analysis, was conducted to investigate the potential mechanisms through which NAT10 exerts its effects. Immune cell infiltration analysis, conducted through the ESTIMATE and CIBERSORT algorithms, was performed to examine the association of NAT10 with the tumor microenvironment (TME). A NAT10-related prognostic model was constructed using least absolute shrinkage and selection operator (LASSO) Cox regression on genes that were both positively correlated with NAT10 and were identified as NAT10-mediated ac4C targets by ac4C RNA immunoprecipitation sequencing The model's performance was validated in the TCGA training set (n=285), with 42 events (deaths) and 243 censored cases, and in the GSE2748 external validation set (n=28), with 13 events (deaths) and 15 censored cases. The association between NAT10-related risk scores and immunotherapy response was assessed via the IMvigor210 cohort. Finally, the aberrant expression of NAT10 was confirmed through immunohistochemistry data from the Human Protein Atlas database and our experimental validations from quantitative real-time polymerase chain reaction (qRT-PCR) and Western blot analyses.

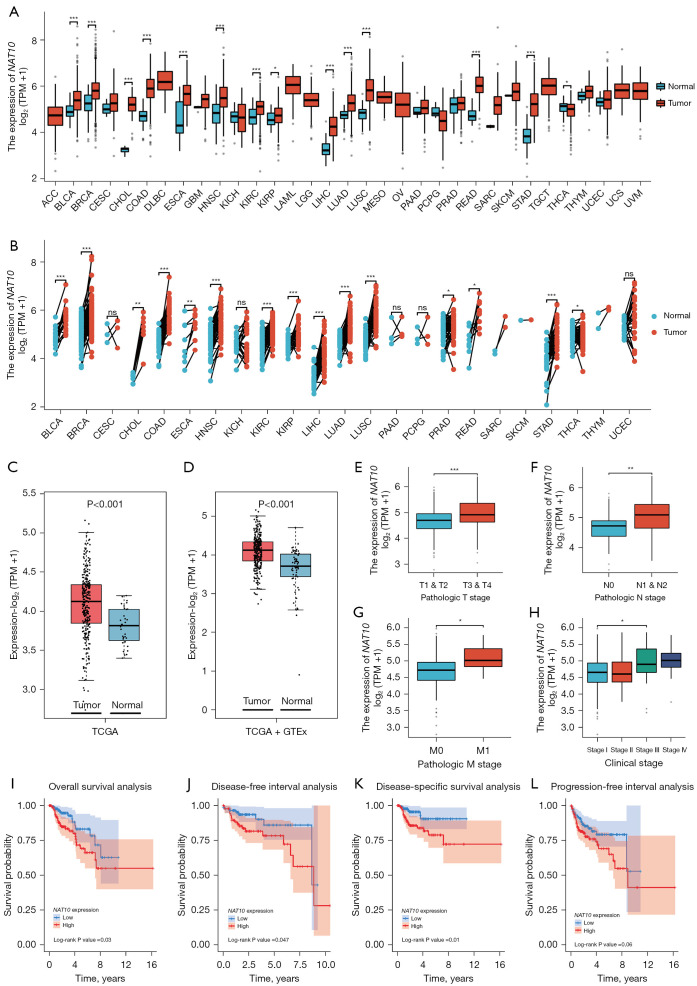
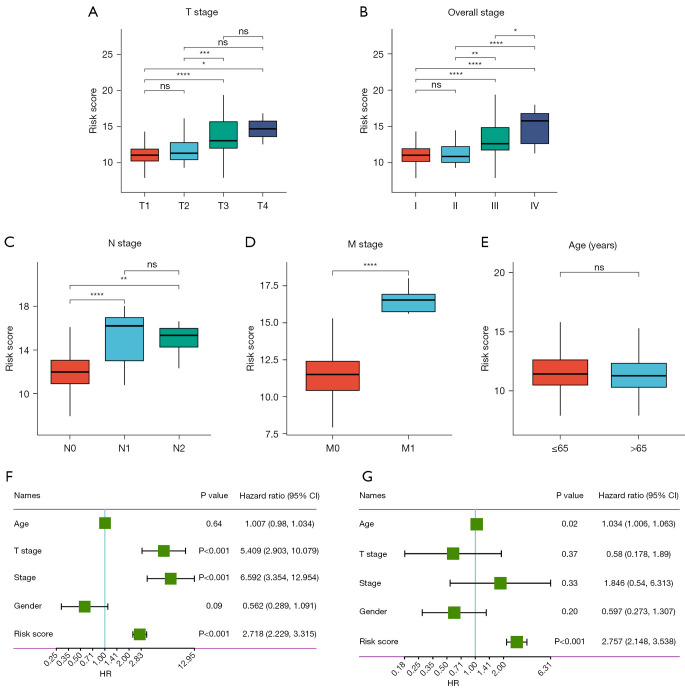
Results: NAT10 is upregulated in multiple cancers, including pRCC, and higher NAT10 expression correlates with advanced stages and poorer prognosis. Single-cell RNA-sequencing data confirmed elevated NAT10 expression in malignant pRCC cells. Pathway enrichment and immune cell infiltration analyses indicated that NAT10 is associated with malignancy-related pathways and a disordered TME. A prognostic model was constructed using LASSO Cox regression, with 18 core genes being identified, and demonstrated high predictive accuracy for survival. The model achieved AUC values of 0.97, 0.93, and 0.82 for 1-, 3-, and 5-year survival in the TCGA training set, respectively, while all AUC values in the GSE2748 external validation set were 1. Higher NAT10-related risk scores were linked to poorer immunotherapy response in the IMvigor210 cohort. NAT10's prognostic significance was validated across various cancers, with elevated expression at both the messenger RNA and protein levels confirmed through immunohistochemistry and experimental validation in RCC cell lines.

Conclusions: Our findings suggest that NAT10 is aberrantly expressed in pRCC, is associated with poor prognosis, and contributes to pRCC progression through multiple pathways, offering new insights into the personalized treatment of patients with pRCC.

Keywords: N-acetyltransferase 10 (NAT10); RNA modification; machine learning; papillary renal cell carcinoma (pRCC).


Conflict of interest statement

Conflicts of Interest: All authors have completed the ICMJE uniform disclosure form (available at https://tcr.amegroups.com/article/view/10.21037/tcr-2024-2195/coif). All authors report that this work was supported by the Natural Science Foundation of Zhejiang Province (No. LY22H160009). The authors have no other conflicts of interest to declare.

Figures

Figure 1
Figure 1
The mRNA expression of NAT10 and its association with clinical characteristics. (A) NAT10 expression levels in various human cancers and normal tissues based on TCGA database. (B) Paired analysis of NAT10 expression in human cancers compared to adjacent normal tissues. Differential expression of NAT10 between tumor and normal tissues in KIRP based on integrated data from (C) TCGA and (D) TCGA and GTEx datasets. The association between NAT10 expression and clinicopathologic characteristics, including (E) T stage, (F) N stage, (G) M stage, and (H) overall tumor stage. Kaplan-Meier curves for (I) overall survival, (J) disease-free interval survival, (K) disease-specific survival, and (L) progression-free survival in KIRP. *, P<0.05; **, P<0.01; ***, P<0.001; ns, not significant. TPM, transcripts per million; TCGA, The Cancer Genome Atlas; GTEx, The Genotype-Tissue Expression. ACC, adrenocortical carcinoma; BLCA, bladder urothelial carcinoma; BRCA, breast cancer; CESC, cervical squamous cell carcinoma and endocervical adenocarcinoma; CHOL, cholangiocarcinoma; COAD, colon adenocarcinoma; DLBC, lymphoid neoplasm diffuse large B-cell lymphoma; ESCA, esophageal carcinoma; GBM, glioblastoma multiforme; HNSC, head and neck squamous cell carcinoma; KICH, kidney chromophobe; KIRC, kidney renal clear cell carcinoma; KIRP, kidney renal papillary cell carcinoma; LAML, acute myeloid leukemia; LGG, brain lower grade glioma; LIHC, liver hepatocellular carcinoma; LUAD, lung adenocarcinoma; LUSC, lung squamous cell carcinoma; MESO, mesothelioma; OV, ovarian serous cystadenocarcinoma; PAAD, pancreatic adenocarcinoma; PCPG, pheochromocytoma and paraganglioma; PRAD, prostate adenocarcinoma; READ, rectum adenocarcinoma; SARC, sarcoma; SKCM, skin cutaneous melanoma; STAD, stomach adenocarcinoma; TGCT, testicular germ cell tumors; THCA, thyroid carcinoma; THYM, thymoma; UCEC, uterine corpus endometrial carcinoma; UCS, uterine carcinosarcoma; UVM, uveal melanoma.
Figure 2
Figure 2
Single-cell mRNA expression of NAT10 and its association with various biological processes and the tumor immune microenvironment. (A) Cell annotation categorized into five major cell groups. (B) CNV scores of annotated cells. (C) NAT10 expression across different cell types. (D) KEGG pathway enrichment results for the top 50 pathways (ranked by P values). (E) Immune score, stromal score, and ESTIMATE score distributions. (F) Correlation heatmap and (G) boxplot illustrating the relationship between NAT10 mRNA expression and 22 immune cell types based on the CIBERSORT method. *, P<0.05; **, P<0.01; ***, P<0.001; ns, not significant. CNV, copy number variant; Exp, expression; NK, natural killer; KEGG, Kyoto Encyclopedia of Genes and Genomes.
Figure 3
Figure 3
Construction and validation of a risk prognosis model built through the LASSO Cox algorithm. (A) Venn diagram showing the intersection of NAT10-related genes and NAT10-mediated ac4C-modified genes. (B) KEGG and GO enrichment analyses of the 897 intersected genes. (C,D) LASSO Cox regression analysis of TCGA dataset. Kaplan-Meier curves for (E) the TCGA cohort and (F) the GEO cohort. ROC analysis of the risk signature for (G) the TCGA cohort and (H) the GEO cohort. BP, biological process; CC, cellular component; KEGG, Kyoto Encyclopedia of Genes and Genomes; MF, molecular function; AUC, area under the curve; LASSO, least absolute shrinkage and selection operator; GO, Gene Ontology; TCGA, The Cancer Genome Atlas; GEO, Gene Expression Omnibus; ROC, receiver operating characteristic.
Figure 4
Figure 4
Association between the NAT10-related risk score and clinicopathologic characteristics of patients with pRCC. The correlation between NAT10-related risk score and (A) T stage, (B) tumor stage, (C) N stage, (D) M stage, and (E) age. (F,G) Univariate and multivariate Cox analyses revealed that the NAT10-related risk score was a valuable independent prognostic factor. *, P<0.05; **, P<0.01; ***, P<0.001; ****, P<0.0001; ns, not significant. T, topography distribution; N, lymph node metastasis; M, distant metastasis; HR, hazard ratio; CI, confidence interval; pRCC, papillary renal cell carcinoma.
Figure 5
Figure 5
Predictive value of the NAT10-related risk score for immunotherapy response in the IMvigor210 cohort. (A) Bar plot showing the immunotherapy response of the low- and high-risk scores. (B) Bar plot depicting the stage distribution between low- and high-risk scores. (C) Box plot of the risk score across different immunotherapy responses. (D) Box plot of the risk score across different stages. (E) Survival curve of patients with low and high risk scores. ****, P<0.0001; ns, not significant. CR, complete response; PR, partial response; SD, stable disease, PD, progressive disease.
Figure 6
Figure 6
Prognostic values and expression of NAT10 in pancancer and experimental validation in RCC cells. (A) Prognostic values of NAT10 mRNA expression for OS, PFI, DSS, and DFI based on TCGA database. (B) Protein expression score of NAT10 in normal tissues based on the HPA datasets (link: https://www.proteinatlas.org/ENSG00000135372-NAT10/tissue). (C) Protein expression of NAT10 in normal kidney (patient id: 2530, stained by antibody CAB035546, link: https://www.proteinatlas.org/ENSG00000135372-NAT10/tissue/kidney#img) and renal cancer tissue (patient id: 1969, stained by antibody CAB035546, link: https://www.proteinatlas.org/ENSG00000135372-NAT10/cancer/renal+cancer#img) based on the HPA datasets. (D) mRNA expression of NAT10 in HK-2, 786-O, and ACHN cell lines. (E) Protein expression of NAT10 in HK-2, 786-O, and ACHN cell lines. **, P<0.01. OS, overall survival; DSS, disease-specific survival; PFI, progression-free interval; DFI, disease-free interval; NA, not available; RCC, renal cell carcinoma; TCGA, The Cancer Genome Atlas; HPA, Human Protein Atlas.

Similar articles

References

    1. Flippot R, Compérat E, Tannir NM, et al. Papillary Renal Cell Carcinoma: A Family Portrait. Eur Urol 2018;73:79-80. 10.1016/j.eururo.2017.06.004 - DOI - PubMed
    1. Steffens S, Janssen M, Roos FC, et al. Incidence and long-term prognosis of papillary compared to clear cell renal cell carcinoma--a multicentre study. Eur J Cancer 2012;48:2347-52. 10.1016/j.ejca.2012.05.002 - DOI - PubMed
    1. Aksionau A, Silva RA, Hartman B, et al. NHERF1/EBP50 immunoexpression in renal cell carcinomas and oncocytomas with ultrastructural analysis of clear cell renal cell carcinoma. Transl Androl Urol 2023;12:1283-95. 10.21037/tau-23-101 - DOI - PMC - PubMed
    1. Herrmann E, Brinkmann OA, Bode ME, et al. Histologic subtype of metastatic renal cell carcinoma predicts response to combined immunochemotherapy with interleukin 2, interferon alpha and 5-fluorouracil. Eur Urol 2007;51:1625-31; discussion 1631-2. 10.1016/j.eururo.2006.11.003 - DOI - PubMed
    1. Motzer RJ, Bacik J, Mariani T, et al. Treatment outcome and survival associated with metastatic renal cell carcinoma of non-clear-cell histology. J Clin Oncol 2002;20:2376-81. 10.1200/JCO.2002.11.123 - DOI - PubMed

LinkOut - more resources