. 2024 Nov 30;13(11):5751-5770.
doi: 10.21037/tcr-24-683. Epub 2024 Nov 27.

Construction of ferroptosis and pyroptosis model to assess the prognosis of gastric cancer patients based on bioinformatics

Affiliations

Construction of ferroptosis and pyroptosis model to assess the prognosis of gastric cancer patients based on bioinformatics

Hanlu Shi et al. Transl Cancer Res. .

Abstract

Background: Gastric cancer (GC) is a malignancy with a grim prognosis, ranking as the second most common cause of cancer-related deaths globally. Various investigations have demonstrated the substantial involvement of ferroptosis and pyroptosis in the advancement of tumors. Nevertheless, the precise molecular mechanisms by which distinct genes associated with ferroptosis and pyroptosis influence the tumor microenvironment (TME) in GC remain elusive. Therefore, this study aims to elucidate the role of ferroptosis and pyroptosis in GC and provide insigths for GC therapy and prognosis evaluation.

Methods: The data including gene expression, clinicopathological characteristics and survival information of GC samples from The Cancer Genome Atlas (TCGA) and Gene Expression Omnibus (GEO) cohorts were collected, and the expression level of ferroptosis and pyroptosis genes (FPGs) in GC samples were analyzed. Consensus clustering analysis, Cox logistic regression, principal component analysis (PCA), and the "survival", "survminer", "limma", "ggplot2" and other packages in R were utilized to compare the differences among different groups. In the level of GC cells, cell viability experiments were conducted by Cell Counting Kit-8 (CCK-8) assay.

Results: Through the analysis of the expression level of FPGs in GC samples from the TCGA and GEO cohorts, twenty-three prognostic-related and differentially expressed FPGs were collected for further analysis. Through consensus clustering analysis, three distinct patterns of FPGs were identified and found to be correlated with clinicopathological characteristics, immune cell infiltration, and prognosis in patients with GC. Subsequently, 684 prognostic-related genes from 1,082 pattern-related differentially expressed genes (DEGs) were screened for constructing the FPG_Score system to quantify FPGs patterns in individual GC patients and predict the prognosis. The analysis indicated that GC patients with high FPG_Score exhibited improved survival rates, increased tumor mutation burden (TMB), higher microsatellite instability (MSI), and elevated programmed cell death protein ligand 1 (PD-L1) expression. These patients with high FPG_Score were more likely to benefit from immunotherapy and had a more favorable prognosis.

Conclusions: Our study innovatively provided a comprehensive analysis of FPGs in GC, and constructed the FPG_Score system for stratification of individual patients, so as to predict its benefit from immunotherapy and prognosis.

Keywords: Gastric cancer (GC); ferroptosis; microsatellite stability; pyroptosis; tumor mutational burden.


Conflict of interest statement

Conflicts of Interest: All authors have completed the ICMJE uniform disclosure form (available at https://tcr.amegroups.com/article/view/10.21037/tcr-24-683/coif). G.W. is a member of the Adicon Clinical Laboratories, Inc. The other authors have no conflicts of interest to declare.

Figures

Figure 1
Figure 1
Genetic and transcriptional alternations of FPGs in GC. (A) Heatmap of the FPGs between the normal and the tumor tissues. Blue represents low expression level; red represents high expression level. (B) The forest plot of the univariate Cox logistic regression model depicts the 23 statistically significant prognostic factors of FPGs in TCGA-GC cohort. Hazard ratio >1: risk factors for survival. Hazard ratio <1: protective factors for survival. (C) The mutation frequency of FPGs of GC patients in the TCGA-STAD and GSE84437 cohorts. (D) Frequencies of CNV among the FPGs. Red represents an increase in copy number, and green represents the loss of copy number. (E) Location of CNV alternations in FPGs on 23 chromosomes. (F) Expression distributions of FPGs between normal and GC tissues. ***, P<0.001; **, P<0.01; *, P<0.05. CI, confidence interval; CNV, copy number variation; FPGs, ferroptosis and pyroptosis genes; GC, gastric cancer; TCGA, The Cancer Genome Atlas; STAD, stomach adenocarcinoma.
Figure 2
Figure 2
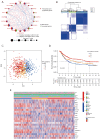
FPGs and clinicopathological characteristics of two distinct patterns of samples divided by consistent clustering. (A) Interactions among FPGs in GC. The line connecting the FPGs represents their interaction, and the line thickness indicates the strength of the association between FPGs. (B) The optimal number of clusters (K=3) was determined from CDF curves. (C) The scatter plot of PCA from three FPG patterns clusters. (D) Survival analysis based on the three FPGs patterns. (E) Differences in clinicopathologic features and expression levels of FPGs between three distinct patterns. FPG, ferroptosis and pyroptosis gene; TCGA, The Cancer Genome Atlas; GC, gastric cancer; PCA, principal component analysis; CDF, cumulative distribution function.
Figure 3
Figure 3
The biological characteristics of three FPGs patterns. (A) GSVA analyzed the differences between functional pathways in FPGs pattern A and B. (B) GSVA analyzed the differences between functional pathways in FPGs pattern A and C. (C) GSVA analyzed the differences between functional pathways in FPGs pattern B and C. Blue represents the FPGs pattern A, orange represents the FPGs pattern B and red represents the FPGs pattern C. FPG, ferroptosis and pyroptosis gene; TCGA, The Cancer Genome Atlas; KEGG, Kyoto Encyclopedia of Genes and Genomes; GSVA, gene set variation analysis.
Figure 4
Figure 4
Characterization of TME cell infiltration and transcriptome features in three FPGs patterns. (A) The differential expression analysis of 23 immune cells among three FPGs patterns. ***, P<0.001; **, P<0.01; *, P<0.05. (B) Venn plots showing the overlapping genes in three FPGs patterns. (C) GO enrichment analysis of subtypes. (D) KEGG enrichment analysis of subtypes. (E) The heatmap of clinicopathologic characteristics and FPGs patterns. (F) Kaplan-Meier curves of the three gene clusters. MDSC, myeloid-derived suppressor cell; BP, biological process; CC, cellular component; MF, molecular function; FPG, ferroptosis and pyroptosis gene; TCGA, The Cancer Genome Atlas; TME, tumor microenvironment; GO, Gene Ontology; KEGG, Kyoto Encyclopedia of Genes and Genomes.
Figure 5
Figure 5
The development of ferroptosis and pyroptosis signature. (A) Differences in the expression of 23 FPGs among the three gene clusters. ***, P<0.001; *, P<0.05. (B) Sankey diagrams of different genotypes. (C) The correlation analysis between the FPG_Score and immune cells, * represents statistical significance; the larger the circle, the smaller the P value. (D) Survival analysis of the high FPG_Score group and low FPG_Score group. (E) Differential expression analysis of FPG_Score among the three FPGs patterns. (F) Differential expression analysis of FPG_Score among the three gene clusters. FPG, ferroptosis and pyroptosis gene; FPG_Score, ferroptosis/pyroptosis score; MDSC, myeloid-derived suppressor cell.
Figure 6
Figure 6
The characteristics of FPG_Score and TMB. (A) Spearman correlation analysis of the FPG_Score and TMB. (B) Correlations between FPG_Score and TMB calculated by CIBERSORT algorithm. (C,D) The waterfall plot displays the somatic mutation features that are stratified by high or low FPG_Score. The blue and yellow box represents high and low FPG_Score, respectively. The upper or right bar plot displayed the TMB and proportion of different mutation types, respectively. (E) Kaplan-Meier curves of survival probability of patients with gastric cancer in low or high TMB group. (F) Survival analysis among four groups of gastric cancer samples according to both levels of TMB combined with FPG_Score. FPG_Score, ferroptosis/pyroptosis score; H, high; L, low; TMB, tumor mutation burden.
Figure 7
Figure 7
Comprehensive analysis of the prognostic value according to FPG_Score. (A,B) Expression levels of PD-L1 and PD-1 in the two FPG_Score groups. (C,D) Stratified analysis of the FPG_Score for GC patients by status. (E,F) Kaplan-Meier analysis of the FPG_Score for GC patients by T stages. (G,H) Relationships between FPG_Score, MSI, and MSS. FPG_Score, ferroptosis/pyroptosis score; PD-L1, programmed cell death protein ligand 1; PD-1, programmed cell death protein 1; MSS, microsatellite stability; MSI-L, low microsatellite instability; MSI-H, high microsatellite instability; GC, gastric cancer.
Figure 8
Figure 8
The expression of ferroptosis-pyroptosis-related genes in cell identities. (A) The PPI network for TXNIP and FPGs by Cytoscape. (B) Identification of cell clusters by t-SNE. (C) A cell annotation of clusters identified by t-SNE. (D) The expression level of each ferroptosis-pyroptosis-related risk model gene in different clusters. (E,F) The violin plot of expression of ferroptosis-pyroptosis-related genes in cell subsets 8F the bubble diagram of expression of ferroptosis-pyroptosis-related genes in cell subsets. t-SNE, t-distributed stochastic neighbor embedding; FPG, ferroptosis and pyroptosis gene; PPI, protein-protein interaction.
Figure 9
Figure 9
The combined effects of ferroptosis inducer and pyroptosis inducer on cell viability and ROS. (A) The BGC823 cells were exposed to erastin and α-KG, then cell viability was measured by CCK-8 assay. *, P<0.05; **, P<0.01. (B) The BGC823 cells were exposed to erastin and α-KG, and ROS level was measured by flow cytometry. α-KG, α-ketoglutarate; DCF, 2,7-dichlorofluorescein; ROS, reactive oxygen species; CCK-8, Cell Counting Kit-8.

Similar articles

Cited by

References

    1. Joshi SS, Badgwell BD. Current treatment and recent progress in gastric cancer. CA Cancer J Clin 2021;71:264-79. 10.3322/caac.21657 - DOI - PMC - PubMed
    1. Zeng R, Gou H, Lau HCH, et al. Stomach microbiota in gastric cancer development and clinical implications. Gut 2024;gutjnl-2024-332815. - PMC - PubMed
    1. Wu H, Fu M, Liu J, et al. The role and application of small extracellular vesicles in gastric cancer. Mol Cancer 2021;20:71. 10.1186/s12943-021-01365-z - DOI - PMC - PubMed
    1. Hu W, Zhou C, Jing Q, et al. FTH promotes the proliferation and renders the HCC cells specifically resist to ferroptosis by maintaining iron homeostasis. Cancer Cell Int 2021;21:709. 10.1186/s12935-021-02420-x - DOI - PMC - PubMed
    1. Li Y, Wang X, Huang Z, et al. CISD3 inhibition drives cystine-deprivation induced ferroptosis. Cell Death Dis 2021;12:839. 10.1038/s41419-021-04128-2 - DOI - PMC - PubMed

LinkOut - more resources