. 2024 Nov 30;13(11):6105-6116.
doi: 10.21037/tcr-24-1091. Epub 2024 Nov 27.

Emerging functions of FMNL1 in myeloid neoplasms: insights from bioinformatics to biological and pharmacological landscapes

Affiliations

Emerging functions of FMNL1 in myeloid neoplasms: insights from bioinformatics to biological and pharmacological landscapes

João Agostinho Machado-Neto et al. Transl Cancer Res. .

Abstract

Background: Myeloid neoplasms encompass disorders characterized by abnormal myeloid cell proliferation and differentiation, including myelodysplastic syndromes (MDS), myeloproliferative neoplasms, acute myeloid leukemia (AML), and chronic myeloid leukemia (CML). Formin-like protein 1 (FMNL1) is involved in the regulation of the actin cytoskeleton and is predominantly expressed in hematopoietic cells. Given its role in leukemia cell proliferation, survival, migration, and invasion, this study investigates FMNL1 expression in normal hematopoiesis and myeloid neoplasms and explores associations with clinical-laboratory characteristics, mutational status, and survival outcomes in AML.

Methods: Transcript levels of FMNL1 from several blood-forming cell populations and myeloid neoplasms were extracted from publicly available databases. Myeloid neoplasm cell lines were used for gene/protein expression and cell differentiation studies. Functional genomics analysis was performed using RNA-seq data from The Cancer Genome Atlas (TCGA) AML study, and drug sensitivity predictions were investigated using Beat AML and Genomics of Drug Sensitivity in Cancer (GDSC) datasets. Statistical analyses assessed the impact of FMNL1 expression on clinical outcomes.

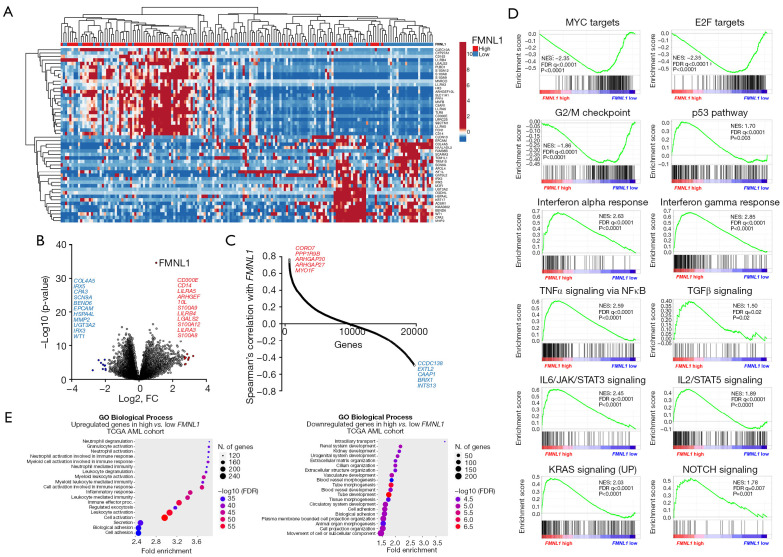
Results: FMNL1 was highly expressed in metamyelocytes, neutrophils, and monocytes compared to hematopoietic stem cells, and its expression increased with granulocytic differentiation. FMNL1 expression was elevated in AML and CML patients compared to healthy donors. FMNL1 expression was not significantly associated with clinical-laboratory characteristics or survival outcomes but showed a higher frequency of WT1 transcription factor (WT1) mutations with low FMNL1 expression in AML patients. High FMNL1 expression in AML correlated with immune response and inflammatory activity pathways. FMNL1 mRNA levels influenced drug sensitivity in AML models, with correlations observed for specific antineoplastic agents.

Conclusions: FMNL1 plays a potential role in granulocyte differentiation and function, and its differential expression is linked to critical signaling pathways in leukemogenesis and inflammation. These findings highlight FMNL1's potential therapeutic implications in myeloid neoplasia, warranting further investigation.

Keywords: Myeloid neoplasms; acute myeloid leukemia (AML); bioinformatics; formin-like protein 1 (FMNL1); functional genomics.


Conflict of interest statement

Conflicts of Interest: All authors have completed the ICMJE uniform disclosure form (available at https://tcr.amegroups.com/article/view/10.21037/tcr-24-1091/coif). J.A.M.N. serves as an unpaid editorial board member of Translational Cancer Research from September 2023 to August 2025. The other authors have no conflicts of interest to declare.

Figures

Figure 1
Figure 1
FMNL1 expression in normal myelopoiesis and upon granulocytic cell differentiation. (A) Graphical legend for the myeloid differentiation hierarchy illustrating the analyzed cell subpopulations used in the analysis. This image was performed using Servier Medical Art (licensed under CC BY 4.0, link to the license: https://smart.servier.com/). This figure was adapted with permission from Carvalho et al. (14). (B) Gene expression profile of FMNL1 (probe 204789_at) in myeloid cell subpopulations (GSE24759). The P values and cell lineages are indicated in the graphs: *, P<0.05 cell lineage vs. HSC1, #, P<0.01 cell lineage vs. HSC2; ANOVA and Bonferroni post hoc test. (C) Rosenfeld-stained cytospin preparation (magnification ×400 and ×1,000), (D) histogram of CD11b expression and (E) FMNL1 mRNA and (F) protein levels in NB4 upon ATRA-induced granulocytic differentiation (1 µM ATRA for 72 h) compared to vehicle-treated cells. These data are representative of at least three independent experiments. The bars indicate the mean ± SD of at least four independent experiments. *, P<0.05; Student’s t-test. HSC, hematopoietic stem cells; CMP, common myeloid progenitor; GMP, granulocyte/macrophage progenitor; MEP, megakaryocyte/erythrocyte progenitor; ERY, erythrocytes; MEGA, megakaryocytes; META, metamyelocytes; NEU, neutrophils; EOS, eosinophils; BASO, basophils; MONO, monocytes; FMNL1, formin-like protein 1; ATRA, all-trans retinoic acid; ANOVA, analysis of variance; SD, standard deviation.
Figure 2
Figure 2
FMNL1 is highly expressed in CML and acute myeloid leukemia. (A) FMNL1 mRNA levels were compared between samples from normal hematopoietic cells, MDS, CMML, CML, and AML patients. The “y” axis represents mRNA expression levels at arbitrary values. Number of subjects for each group are indicated. The data sets were cross-referenced using tumor-specific identification numbers. **, P<0.001; Kruskal-Wallis test and Dunn post-hoc test. (B) FMNL1 expression was compared among AML patients from TCGA cohort stratified by molecular risk. Number of subjects for each group are indicated. (C) FMNL1 expression in the different cytogenetics subtypes of AML was obtained from the BloodSpot. (D) Kaplan-Meier curves represent overall survival for AML patients dichotomized according to high or low FMNL1 expression. HR, 95% confidence interval, and P values are indicated (log-rank test). FMNL1 mRNA (E) and protein (F) levels in myeloid neoplasm cell lines. HD, healthy donors; MDS, myelodysplastic syndromes; CMML, chronic myelomonocytic leukemia; CML, chronic myeloid leukemia; AML, acute myeloid leukemia; FMNL1, formin-like protein 1; TCGA, The Cancer Genome Atlas; HR, hazard ratio; GAPDH, glyceraldehyde-3-phosphate dehydrogenase.
Figure 3
Figure 3
High FMNL1 mRNA levels are associated with immune response and inflammatory activity in acute myeloid leukemia. (A) Heatmap summarizes the expression of the top 25 upregulated and 25 downregulated genes for high versus low FMNL1 expression. Color intensity represents the ɀ-score within each row. (B) Volcano plots depicting the extent (x-axis) and significance (y-axis) of differential gene expression for each gene, comparing high versus low FMNL1. Blue dots represent the top 10 downregulated genes, red dots represent the top 10 upregulated genes and black dots represent the remaining genes. (C) Spearman correlation shows the genes positively and negatively correlating with the FMNL1 in AML TCGA patients. (D) GSEA plots for biological processes associated with FMNL1 expression in AML patients. FDR-adjusted P values (NOM P value), and enrichment scores NES are indicated. (E) Representative ShinyGO plots reflect the main 20 biological processes associated with upregulated or downregulated genes in high vs. low FMNL1 AML patients. FMNL1, formin-like protein 1; FC, fold-change; NES, normalized for gene set size; FDR, false discovery rate; GO, Gene Ontology; TCGA, The Cancer Genome Atlas; AML, acute myeloid leukemia; GSEA, gene set enrichment analysis; NOM, nominal.
Figure 4
Figure 4
Association between FMNL1 expression and drug sensitivity in ex vivo and in vitro assays in acute myeloid leukemia. Drug sensitivity according to FMNL1 expression in ex vivo (A) and in vitro (B) assays. Drugs with P<0.05, as determined by the Spearman correlation test, are indicated. Blue dots represent drugs significantly associated with sensitivity, red dots represent drugs significantly associated with resistance and black dots represent the remaining drugs. (C) The molecular targets (proteins/genes) of the identified drugs were listed and analyzed by GeneMANIA software to determine the biological and molecular processes associated with the sensitivity and resistance correlated to FMNL1 expression. FDR values are indicated. FMNL1, formin-like protein 1; AML, acute myeloid leukemia; FDR, false discovery rate.

Similar articles

References

    1. Arber DA, Orazi A, Hasserjian R, et al. The 2016 revision to the World Health Organization classification of myeloid neoplasms and acute leukemia. Blood 2016;127:2391-405. 10.1182/blood-2016-03-643544 - DOI - PubMed
    1. Korn C, Méndez-Ferrer S. Myeloid malignancies and the microenvironment. Blood 2017;129:811-22. 10.1182/blood-2016-09-670224 - DOI - PMC - PubMed
    1. Arber DA, Orazi A, Hasserjian RP, et al. International Consensus Classification of Myeloid Neoplasms and Acute Leukemias: integrating morphologic, clinical, and genomic data. Blood 2022;140:1200-28. 10.1182/blood.2022015850 - DOI - PMC - PubMed
    1. Parmar K, Kundu R, Maiti A, et al. Updates in biology, classification, and management of acute myeloid leukemia with antecedent hematologic disorder and therapy related acute myeloid leukemia. Leuk Res 2024;144:107546. 10.1016/j.leukres.2024.107546 - DOI - PubMed
    1. Colón-Franco JM, Gomez TS, Billadeau DD. Dynamic remodeling of the actin cytoskeleton by FMNL1γ is required for structural maintenance of the Golgi complex. J Cell Sci 2011;124:3118-26. 10.1242/jcs.083725 - DOI - PMC - PubMed

LinkOut - more resources