. 2024 Nov 30;13(11):5856-5872.
doi: 10.21037/tcr-24-650. Epub 2024 Nov 20.

Identification of the CD8+ T-cell exhaustion signature of hepatocellular carcinoma for the prediction of prognosis and immune microenvironment by integrated analysis of bulk- and single-cell RNA sequencing data

Affiliations

Identification of the CD8+ T-cell exhaustion signature of hepatocellular carcinoma for the prediction of prognosis and immune microenvironment by integrated analysis of bulk- and single-cell RNA sequencing data

Jianhui Fan et al. Transl Cancer Res. .

Abstract

Background: Hepatocellular carcinoma (HCC) is a prevalent type of cancer with high incidence and mortality rates. It is the third most common cause of cancer-related deaths. CD8+ T cell exhaustion (TEX) is a progressive decline in T cell function due to sustained T cell receptor stimulation from continuous antigen exposure. Studies have shown that CD8+ TEX plays an important role in the anti-tumor immune process and is significantly correlated with patient prognosis. The aim of the research is to establish a reliable CD8+ TEX-based signature using single-cell RNA sequencing (scRNA-seq) and high-throughput RNA sequencing (RNA-seq), providing a new approach to evaluate HCC patient prognosis and immune microenvironment.

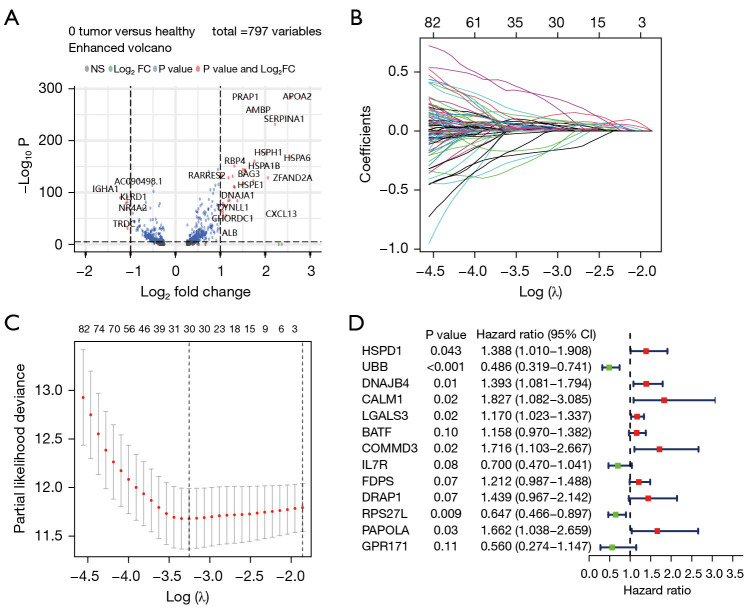
Methods: The RNA-seq data of HCC patients were download from three different databases: The Cancer Genome Atlas (TCGA), the Gene Expression Omnibus (GEO), and the International Cancer Genome Consortium (ICGC). HCC's 10× scRNA data were acquired from GSE149614. Based on single-cell sequencing data, CD8+ TEX-related genes were identified using uniform manifold approximation and projection (UMAP) algorithm, singleR, and marker gene methods. Afterwards, we proceeded to construct CD8+ TEX signature using differential gene analysis, univariate Cox regression analysis, least absolute shrinkage and selection operator (LASSO) regression, and multivariate Cox regression analysis. We also validated the CD8+ TEX signature in GEO and ICGC external cohorts and investigated clinical characteristics, chemotherapy sensitivity, mutation landscape, functional analysis, and immune cell infiltration in different risk groups.

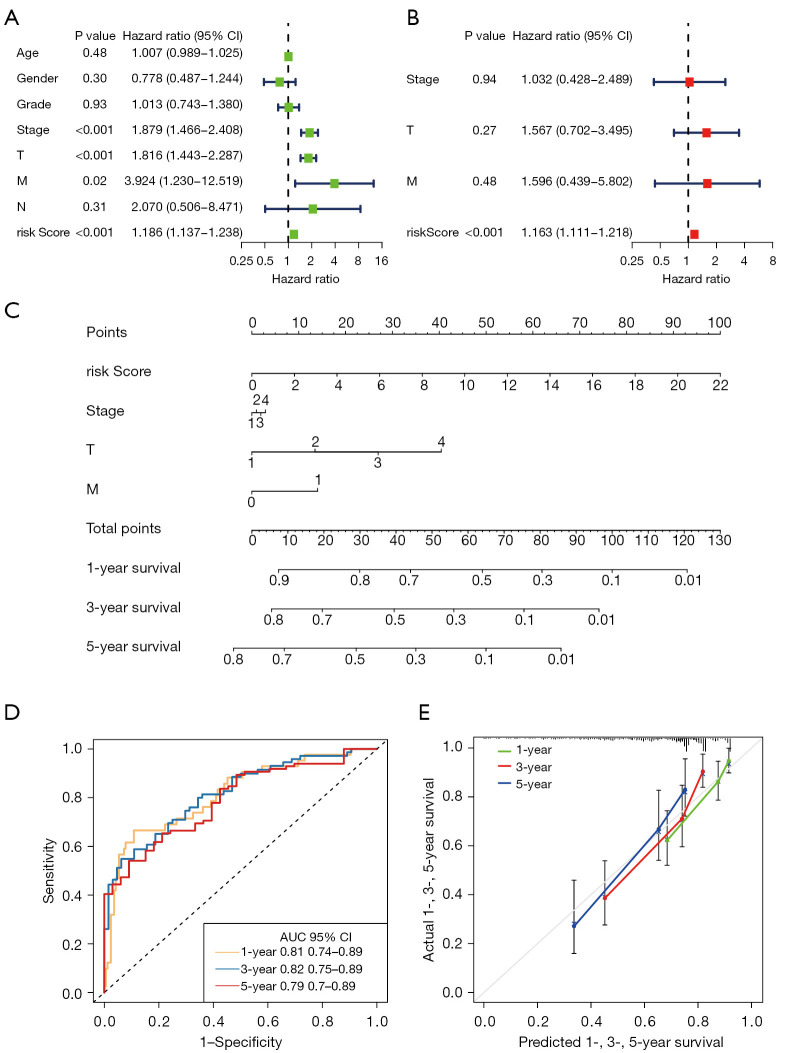
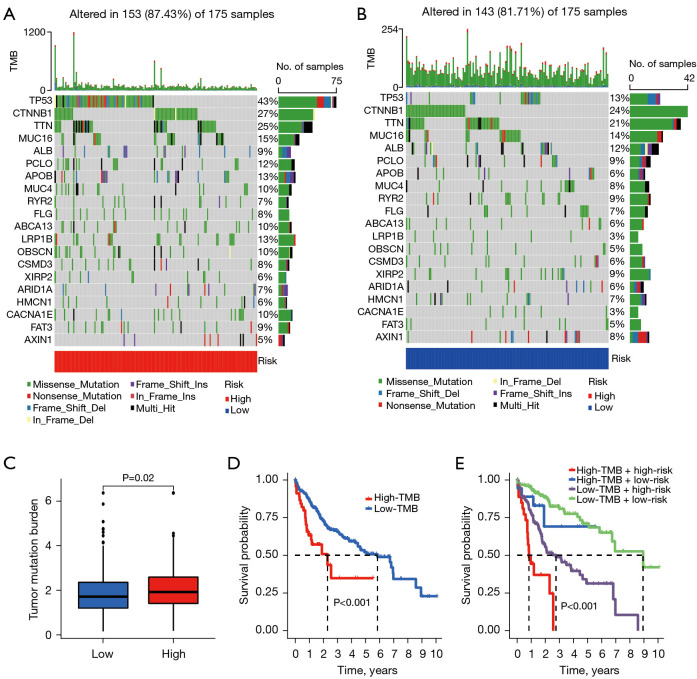
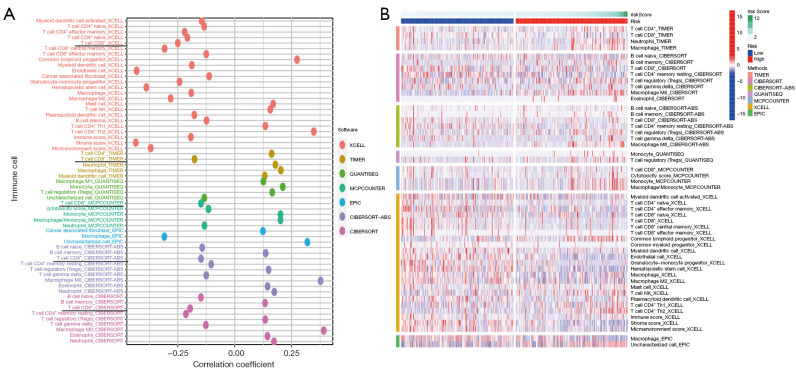
Results: The CD8+ TEX signature, consisting of 13 genes (HSPD1, UBB, DNAJB4, CALM1, LGALS3, BATF, COMMD3, IL7R, FDPS, DRAP1, RPS27L, PAPOLA, GPR171), was found to have a strong predictive effect on the prognosis of HCC. The Kaplan-Meier (KM) analysis showed that the overall survival (OS) rate of patients in the low-risk group was higher than that of patients in the high-risk group across different datasets and specific populations. The research findings suggested that the risk score was an independent predictor of HCC prognosis. The model based on clinical features and risk score has a strong predictive effect. We observed significant differences among various risk groups in terms of clinical characteristics, functional analysis, mutation landscape, chemotherapy sensitivity, and immune cell infiltration.

Conclusions: We constructed a CD8+ TEX signature to predict the survival probability of patients with HCC. We also found that the model could predict the sensitivity of targeted drugs and immune cell infiltration, and the risk score was negatively correlated with CD8+ T cell infiltration. In summary, the CD8+ TEX signature of HCC was constructed for the prediction of prognosis and immune microenvironment by integrated analysis of bulk and scRNA-seq data.

Keywords: CD8+ T cell exhaustion (CD8+ TEX); hepatocellular carcinoma (HCC); immunotherapy; prognosis; single-cell RNA sequencing (scRNA-seq).


Conflict of interest statement

Conflicts of Interest: All authors have completed the ICMJE uniform disclosure form (available at https://tcr.amegroups.com/article/view/10.21037/tcr-24-650/coif). The authors have no conflicts of interest to declare.

Figures

Figure 1
Figure 1
A schematic of the study design. scRNA-seq, single-cell RNA sequencing; NK, natural killer; RNA-seq, RNA sequencing; TCGA, The Cancer Genome Atlas; ICGC, International Cancer Genome Consortium; GO, Gene Ontology; KEGG, Kyoto Encyclopedia of Genes and Genomes; BP, biological process; CC, cellular component; MF, molecular function; TMB, tumor mutation burden; IC50, half-maximal inhibitory concentration.
Figure 2
Figure 2
Overview of single cells from tumor samples and normal samples. (A) Cells in tumor samples and normal samples were divided into 29 clusters based on the UMAP algorithm. (B) Different clusters cells were annotated through the ‘SingleR’ package. (C) Different clusters cells were verified based on marker genes. UMAP, uniform manifold approximation and projection; NK, natural killer.
Figure 3
Figure 3
Construction of the risk model based on CD8+ T cell DEGs in in tumor samples and normal samples. (A) The volcano map of DEGs in the TCGA cohort. (B) The coefficient of CD8+ T cell-related genes was calculated using LASSO regression analysis. (C) 30 CD8+ T cell-related genes were selected using LASSO regression analysis. (D) Multivariate Cox analysis was performed to identify the genes that constructed the model. NS, not significant; FC, fold change; CI, confidence interval; DEGs, differentially expressed genes; TCGA, The Cancer Genome Atlas; LASSO, least absolute shrinkage and selection operator.
Figure 4
Figure 4
Establishment and validation of a prognostic risk model based on CD8+ related genes. (A) Kaplan-Meier analysis between the low-risk group and the high-risk group in TCGA dataset. (B) Kaplan-Meier analysis between the low-risk group and the high-risk group in GSE14520 dataset. (C) Kaplan-Meier analysis between the low-risk group and the high-risk group in ICGC-LIRI-JP dataset. (D) In TCGA dataset, the areas under the ROC curves for predicting 1-, 3- and 5-year OS. (E) In GSE14520 dataset, the areas under the ROC curves for predicting 1-, 3- and 5-year OS. (F) In ICGC-LIRI-JP dataset, the areas under the ROC curves for predicting 1- and 3-year OS. AUC, area under the curve; TCGA, The Cancer Genome Atlas; ROC, receiver operating characteristic; ICGC, International Cancer Genome Consortium; OS, overall survival.
Figure 5
Figure 5
The distribution of clinical features in different risk groups. (A) Heatmap of clinical and pathological variables in the high-risk and low-risk group. (B-H) Proportions of patients with different clinical subtypes (age, gender, grade, stage, T stage, N stage, M stage) in the high-risk and low-risk group. ***, P<0.001, with significant statistical significance.
Figure 6
Figure 6
Survival analysis of different risk groups in different subgroups of HCC patient. (A,B) Survival analysis of different risk groups in different age subgroups. (C,D) Survival analysis of different risk groups in different gender subgroups. (E,F) Survival analysis of different risk groups in different grade subgroups. (G,H) Survival analysis of different risk groups in different stage subgroups. (I,J) Survival analysis of different risk groups in different T stage subgroups. HCC, hepatocellular carcinoma.
Figure 7
Figure 7
Establishment and evaluation of a nomogram for predicting patient 1-, 3- and 5-year OS. (A) Univariate analysis of risk score and clinicopathological characteristics. (B) Multivariate analysis of risk score and clinicopathological characteristics. (C) A nomogram for predicting 1-, 3- and 5-year OS. (D) The areas under the ROC curves for predicting 1-, 3- and 5-year OS. (E) The calibration curves for predicting 1-, 3- and 5-year OS. CI, confidence interval; AUC, area under the curve; OS, overall survival; ROC, receiver operating characteristic.
Figure 8
Figure 8
Function enrichment analysis in different risk groups. (A,B) GO enrichment pathway. (C,D) The difference between the high-risk group and low-risk group in KEGG enrichment pathways. BP, biological process; CC, cellular component; MF, molecular function; GO, Gene Ontology; KEGG, Kyoto Encyclopedia of Genes and Genomes.
Figure 9
Figure 9
Gene mutations and TMB analysis in different risk groups. (A) The top 20 driver genes with the highest alteration in the high-risk group. (B) The top 20 driver genes with the highest alteration in the low-risk group. (C) Violin plot revealing the difference between high-risk and low-risk groups in TMB. (D) Kaplan-Meier analysis for the high-TMB and low-TMB groups. (E) Kaplan-Meier analysis for the four groups divided by TMB and risk score. TMB, tumor mutation burden.
Figure 10
Figure 10
IC50 of different chemotherapeutic drugs in high-risk and low-risk group. (A-D) Patients in the low-risk group were more sensitive to axitinib (A), erlotinib (B), gefitinib (C), lapatinib (D) (P<0.001). (E-H) The patients in the high-risk group were more sensitive to PD.173074 (E), tipifarnib (F), vinorelbine (G) and sorafenib (H) (P<0.001). IC50, half-maximal inhibitory concentration.
Figure 11
Figure 11
The relationship between tumor microenvironment score, immune cell infiltration and risk score was analyzed comprehensively. (A-D) Stromal score, immune score, ESTIMATE score and purity of tumor in high-risk group and low-risk group. (E,F) The risk score was negatively correlated with the abundances of CD8+ T cells (E), B cells naive (F). (G,H) The risk score was positively correlated with the abundances of regulatory T cells (G), macrophages M0 (H). ESTIMATE, Estimation of STromal and Immune cells in MAlignant Tumor tissues using Expression data.
Figure 12
Figure 12
The relationship between prognostic signature and immune infiltration. (A) The correlation between risk score and immune cell infiltration was analyzed by Spearman correlation analysis using different algorithms. (B) The heatmap of immune infiltration based on different algorithms among the high-risk and low-risk groups.

Similar articles

References

    1. Toh MR, Wong EYT, Wong SH, et al. Global Epidemiology and Genetics of Hepatocellular Carcinoma. Gastroenterology 2023;164:766-82. 10.1053/j.gastro.2023.01.033 - DOI - PubMed
    1. Llovet JM, Kelley RK, Villanueva A, et al. Hepatocellular carcinoma. Nat Rev Dis Primers 2021;7:6. 10.1038/s41572-020-00240-3 - DOI - PubMed
    1. Hanahan D, Weinberg RA. Hallmarks of cancer: the next generation. Cell 2011;144:646-74. 10.1016/j.cell.2011.02.013 - DOI - PubMed
    1. Mittrücker HW, Visekruna A, Huber M. Heterogeneity in the differentiation and function of CD8+ T cells. Arch Immunol Ther Exp (Warsz) 2014;62:449-58. 10.1007/s00005-014-0293-y - DOI - PubMed
    1. Shibutani M, Maeda K, Nagahara H, et al. The Prognostic Significance of the Tumor-infiltrating Programmed Cell Death-1(+) to CD8(+) Lymphocyte Ratio in Patients with Colorectal Cancer. Anticancer Res 2017;37:4165-72. - PubMed

LinkOut - more resources