. 2024 Dec 17;14(12):e70687.
doi: 10.1002/ece3.70687. eCollection 2024 Dec.

Arthropod Food Webs in the Foreland of a Retreating Greenland Glacier: Integrating Molecular Gut Content Analysis With Structural Equation Modelling

Affiliations

Arthropod Food Webs in the Foreland of a Retreating Greenland Glacier: Integrating Molecular Gut Content Analysis With Structural Equation Modelling

Ejgil Gravesen et al. Ecol Evol. .

Abstract

The Arctic has warmed nearly four times faster than the global average since 1979, resulting in rapid glacier retreat and exposing new glacier forelands. These forelands offer unique experimental settings to explore how global warming impacts ecosystems, particularly for highly climate-sensitive arthropods. Understanding these impacts can help anticipate future biodiversity and ecosystem changes under ongoing warming scenarios. In this study, we integrate data on arthropod diversity from DNA gut content analysis-offering insight into predator diets-with quantitative measures of arthropod activity-density at a Greenland glacier foreland using Structural Equation Modelling (SEM). Our SEM analysis reveals both bottom-up and top-down controlled food chains. Bottom-up control, linked to sit-and-wait predator behavior, was prominent for spider and harvestman populations, while top-down control, associated with active search behavior, was key for ground beetle populations. Bottom-up controlled dynamics predominated during the early stages of vegetation succession, while top-down mechanisms dominated in later successional stages further from the glacier, driven largely by increasing temperatures. In advanced successional stages, top-down cascades intensify intraguild predation (IGP) among arthropod predators. This is especially evident in the linyphiid spider Collinsia holmgreni, whose diet included other linyphiid and lycosid spiders, reflecting high IGP. The IGP ratio in C. holmgreni negatively correlated with the activity-density of ground-dwelling prey, likely contributing to the local decline and possible extinction of this cold-adapted species in warmer, late-succession habitats where lycosid spiders dominate. These findings suggest that sustained warming and associated shifts in food web dynamics could lead to the loss of cold-adapted species, while brief warm events may temporarily impact populations without lasting extinction effects.

Keywords: Aclastus borealis; Isotoma anglicana; Mitopus morio; NDVI; Nebria rufescens; antipredatory behavior; deglaciation; detritivores; extra‐guild prey; pioneer vegetation.


Conflict of interest statement

The authors declare no conflicts of interest.

Figures

FIGURE 1
FIGURE 1
Position of the 23 observation patches along the study transect down the mountain slope of the Little Qassi mountain (Qassinnguit). Upper transect patchesformula image, 277–291 MASL, in the shadow of the mountain with one wet pitfall trap at each patch; central transect patchesformula image, 242–277 MASL, with partly shadow during a midsummer day with a wet pitfall (blue dot) and a dry pitfall trap (black dot) at each patch; lower transect patchesformula image, 206–242 MASL, without shadow during a midsummer day, with one wet pitfall trap at each patch. Right hand side red arrows show the position of the whole Kobbefjord area (lower right) and the position of the 2014 study transect within the Kobbefjord area east of the Little Qassi Mountain as well as the crowberry formula image and gray willow formula image plots in the Kobbefjord valley.
FIGURE 2
FIGURE 2
Activity‐densities of Linyphiidae, Lycosidae, and the prey groups—Diptera, Collembola, and Acari—in the Qassinnguit glacier foreland as well as in the warmer climax vegetation habitats (crowberry and gray willow) in the Kobbefjord Valley (Greenland Ecosystem Monitoring 2020a). Different letters (a, b, and c) indicate significant differences between years within habitats, while u, v, x, y, and z indicate significant differences between activity‐densities of linyphiids and lycosids in the three different habitats (pioneer, crowberry, and gray willow) across years.
FIGURE 3
FIGURE 3
The relationship between the activity‐densities of Linyphiidae (A), Opiliones (harvestmen) (B), N. rufescens (adult ground beetles) (C), Acarina (mites) (D), Diptera (E), and Collembola (F) and the NDVI obtained by Poisson regression. Full line: Predicted mean model; 95% confidence bands: Dashed lines. Population means and 95% confidence limits from Kobbefjord where crowberry and gray willow habitats are shown as blue and green vertical lines.
FIGURE 4
FIGURE 4
Activity‐density models obtained by Poisson regression of I. anglicana and the sum of potential arthropod predators (spiders, harvestmen, ground beetles, and mites) in vegetated plots in relation to the distance to the glacier snouts at the Qassinnguit, 2016, and Qassi, 2014, glacier forelands. I. anglicana curves represent the upper transect areas away from the glacier snout as well as a decline, further away.
FIGURE 5
FIGURE 5
Linear regression of predator‐to‐prey ratios (Y‐axis) in relation to the Qassinnguit vegetation succession (X‐axis), with the vegetation development axis extended to include climax vegetation areas in the Kobbefjord Valley. The vegetation succession is represented by the first principal component (PC1) of a PCA ordination, based on NDVI, time since deglaciation, and distance to permanent snow cover (Table A3). The PC1 axis accounts for 90% of the variation in the data. “Arachnid Predator” abundance is defined as the sum of activity‐densities for Araneae (spiders) and Opiliones (harvestmen), while “prey” abundance is defined as the sum of activity‐densities for Collembola, Diptera, and Aphidoidea. Black square symbols represent pioneer vegetation in Qassinnguit, and blue and green squares represent crowberry and gray willow habitats in the Kobbefjord Valley. Linear regression results: F = 14.6, p < 0.001, with 95% confidence bands surrounding the regression line.
FIGURE 6
FIGURE 6
Food web construction based on gut content analysis. The studied predators are highlighted with black frames. The width of the links corresponds to the frequency of the observed interaction, representing the number of predators with the prey species identified by DNA metabarcoding in their gut. Red lines show links between N. rufescens and its prey, brown lines show links between M. morio and its prey, and purple lines show links between C. holmgreni and its prey. The outer ring categorizes both predators and prey into their respective taxonomic groups for additional context.
FIGURE 7
FIGURE 7
Food preferences of the predators sampled during the summers of 2015–2016 calculated from the gut content data and potential prey activity‐densities. The observed frequencies (dots) were compared to prey activity‐densities with the 95% CIs from the null model (horizontal lines). formula image 
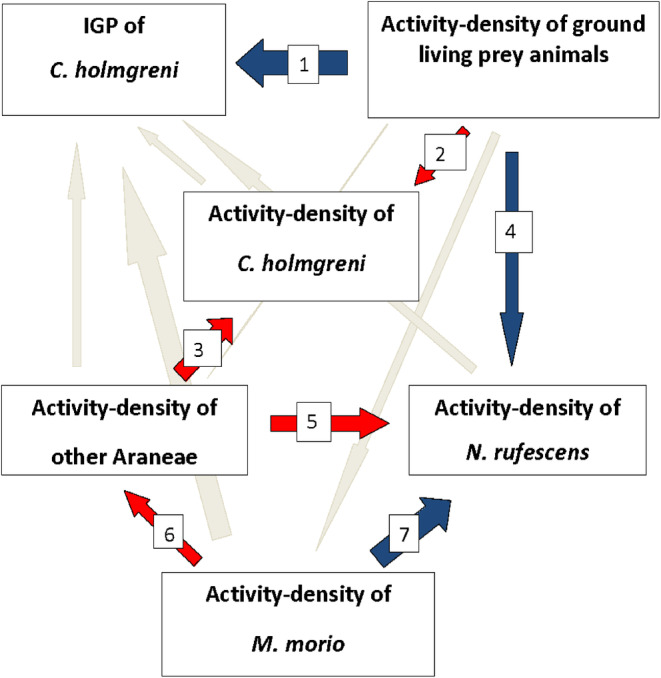
= frequency consistent with the null model (the observed predation frequency corresponded to the expected one based on prey activity‐density and gut content results); formula image = frequency of predation was higher than expected in the null model; formula image = frequency of predation was lower than expected according to the null model.
FIGURE 8
FIGURE 8
The path diagram presents a model, SEM1, for the relationships between activity‐densities of arthropod predators, activity‐densities of potential prey and important environmental variables using Structural Equation Modeling (SEM). Model fit: Chi‐square: 87.6; df: 66; Probability level: 0.039; Sample size: 44; CMIN/df: 1.327. For more information about measures of fit, see the Result section. The thickness of each arrow represents the standardized regression weights. Red arrows show significant positive correlations (p < 0.05) and blue arrows show significant negative correlations (p < 0.05). Pink arrows show nonsignificant positive correlations. Light blue arrows show nonsignificant negative correlation. The number at each arrow refers to more detailed information about each relationship in Table A6. See Acknowledgments for contributions by photographers.
FIGURE 9
FIGURE 9
The path diagram presents SEM2, a model for the relationships between Intraguild Predation (IGP) of C. holmgreni , activity‐density of ground living preys, activity‐density of the ground beetles, activity‐density of the harvestmen, activity‐density of C. holmgreni as well as activity‐density of other Araneae using SEM. Model fit: Chi‐square = 0.021, df = 1; Probability level = 0.886; Sample size = 17; CMIN/df = 0.021; For more information about measures of fit, see the Result section. The thickness of each arrow represents the standardized regression weights. Red arrows show positive correlations and blue arrows show negative correlations. Gray arrows show nonsignificant correlations. The number at each arrow refers to more detailed information in relation to each correlation in Table A7.
FIGURE A1
FIGURE A1
This photo shows the uppermost patch on the Qassinnguit transect without any visible vegetation cover as this area was covered with snow the summer before and there was only little sunlight as there was almost permanent shadow from the mountain to the south. A wet pitfall trap is (barely) visible next to the number “1”. No lichens were found on the rocks at this site.
FIGURE A2
FIGURE A2
A patch at the upper Qassinnguit transect dominated by mosses.
FIGURE A3
FIGURE A3
A typical bare soil patch in the central area with no or almost no (pioneer) vegetation cover as the patch may be flooded during snow melt in spring time. In the middle of the photo is a dry pitfall trap half‐filled with green styrofoam chips and X‐shaped guidance barriers.
FIGURE A4
FIGURE A4
A patch with pioneer vegetation cover in the central area which may have some protection from flooding by melting water during spring time.
FIGURE A5
FIGURE A5
The lowest patch on the Qassinnguit transect with a climax vegetation cover consisting of crowberry in the foreground and grey willow in the background to the left and mosses to the right.
FIGURE A6
FIGURE A6
The crowberry climax vegetation habitat in the Kobbefjord valley – with the fjord to the west. This site is exposed to the wind and the sun all day during the summer. A yellow pitfall trap is seen between the low crowberry vegetation layer.
FIGURE A7
FIGURE A7
The grey willow climax vegetation habitat in the Kobbefjord valley ‐ with a lake to the south ‐ which is exposed to sunlight all day during the summer.
FIGURE A8
FIGURE A8
The lichenometric dating method measuring Rhizocarpon thalli diameters.
FIGURE A9
FIGURE A9
Modelling environmental variables against the distance to glacier snout. The relationship between the distance to the glacier snout down the transect and the four significant environmental variables. The curves are the 2nd degree polynomial fit (F < 5%). Missing NDVI values for 2015 were predicted from soil water, organic matter and time since deglaciation.
FIGURE A10
FIGURE A10
SEM model, SEM3, of wheat‐clover bi‐cropping experiment. The path diagram presents a model for the relationships between linyphiid web density, vegetation density, I. anglicana density, linypiid juvenile production, organic matter and soil water content in the top‐soil using Structural Equation Modeling (SEM). Model fit: Chi‐square = 17.65; Probability level = 0.014; df = 7; Sample size = 120. The thickness of each arrow represents the standardized regression weights. Red arrows shows significant positive correlations and blue arrows shows significant negative correlations. Grey arrows shows non‐significant correlations. The numbers at each arrow refers to more detailed information in relation to each correlation in Table A11.
FIGURE A11
FIGURE A11
The proportion of collembolan, dipteran, and aphid prey in the guts of linyphiid spiders, M. morio (harvestmen), and Carabidae (ground beetles). Predators were collected in the summer of 2015 in the three different patch types—gravel, bare soil, and vegetated patches. Numbers on bars indicate the numbers of the three predators analyzed for gut contents. NA, Not applicable.

Similar articles

References

    1. Abrams, P. A. 2010. “Implications of Flexible Foraging for Interspecific Interactions: Lessons From Simple Models.” Functional Ecology 24: 7–17.
    1. Agustí, N. , Shayler S. P., Harwood J. D., Vaughan I. P., Sunderland K. D., and Symondson W. O. C.. 2003. “Collembola as Alternative Prey Sustaining Spiders in Arable Ecosystems: Prey Detection Within Predators Using Molecular Markers.” Molecular Ecology 12: 3467–3475. - PubMed
    1. Ahmed, M. , Else B., Eklundh L., Ardö J., and Seaquist J.. 2017. “Dynamic Response of NDVI to Soil Moisture Variations During Different Hydrological Regimes in the Sahel Region.” International Journal of Remote Sensing 38: 5408–5429.
    1. Allen, D. C. , McCluney K. E., Elser S. R., and Sabo J. L.. 2014. “Water as a Trophic Currency in Dryland Food Webs.” Frontiers in Ecology and the Environment 12: 156–160.
    1. Arbuckle, J. L. 2022. “IBM® SPSS® Amos™ 29 User's Guide.”

LinkOut - more resources