

Combining computed tomography features of left atrial epicardial and pericoronary adipose tissue with the triglyceride-glucose index to predict the recurrence of atrial fibrillation after radiofrequency catheter ablation: a machine learning study
- PMID: 39698730
- PMCID: PMC11651957
- DOI: 10.21037/qims-24-1393
Combining computed tomography features of left atrial epicardial and pericoronary adipose tissue with the triglyceride-glucose index to predict the recurrence of atrial fibrillation after radiofrequency catheter ablation: a machine learning study
Abstract
Background: Radiofrequency catheter ablation (RFCA) represents an important treatment option for atrial fibrillation (AF); however, the recurrence rate following surgery is relatively high. This study aimed to predict the recurrence of AF after RFCA using interpretable machine learning models that combined the triglyceride-glucose (TyG) index and the quantification of left atrial epicardial and pericoronary adipose tissue.
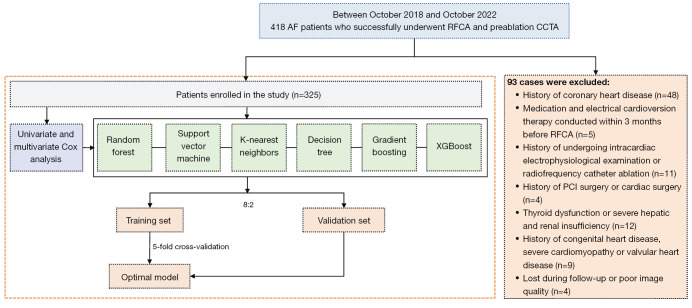
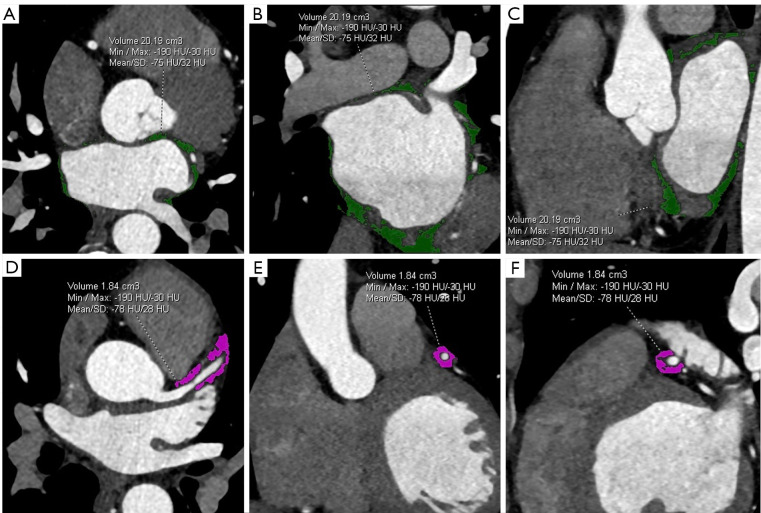
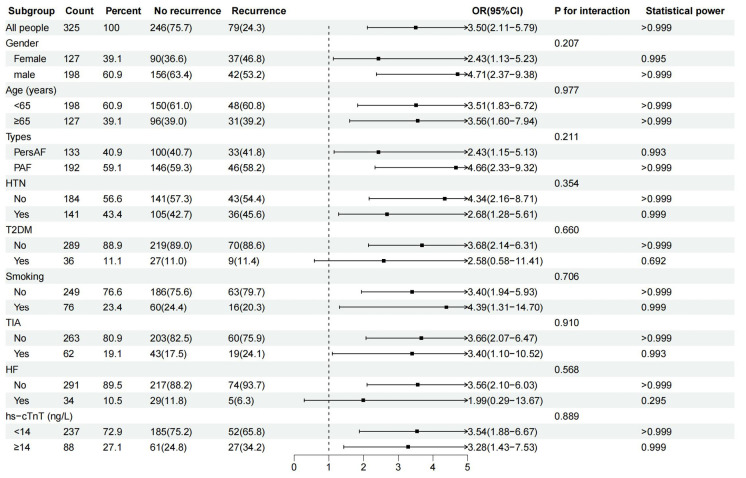
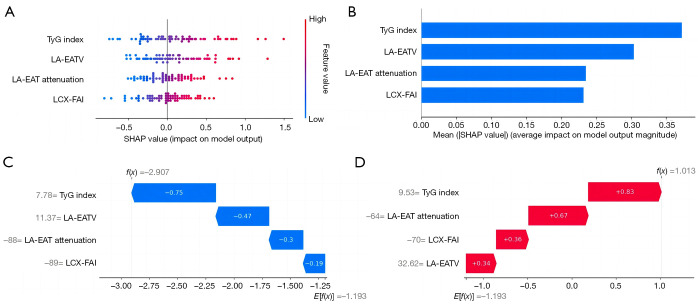
Methods: This retrospective study included 325 patients with AF who underwent their first successful RFCA, among whom 79 had confirmed recurrence. The preoperative clinical data of patients were collected, the TyG index was calculated, and computed tomography (CT) image features were quantitatively measured. Multivariate Cox regression analysis was used to identify the independent risk factors for RFCA recurrence, and adjustments being made for various confounding factors. Post-hoc subgroup analysis was conducted to evaluate the predictive value of the TyG index for recurrence in different patient subgroups. Prediction models based on six machine learning algorithms were constructed. The optimal model's features were evaluated using Shapley additive explanations (SHAP).
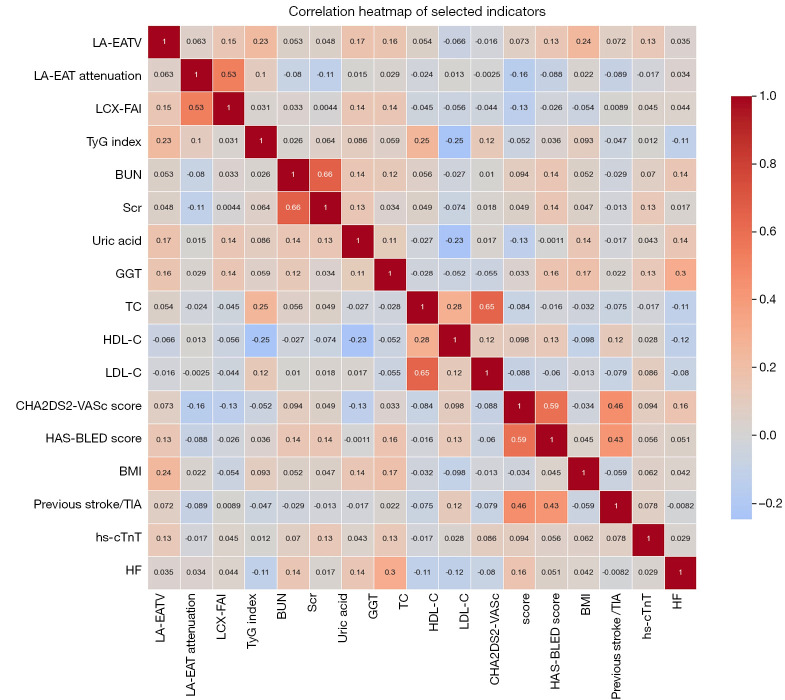
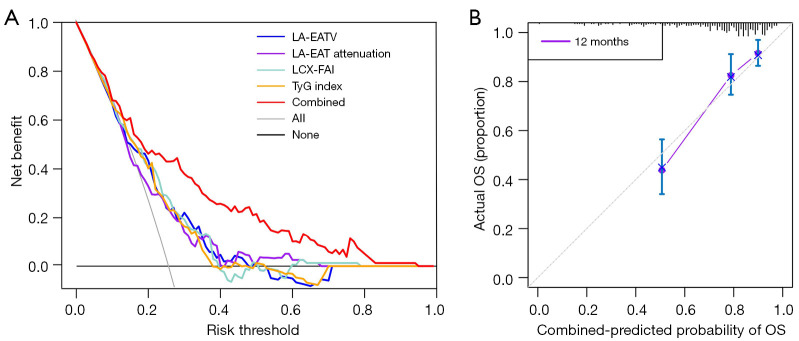
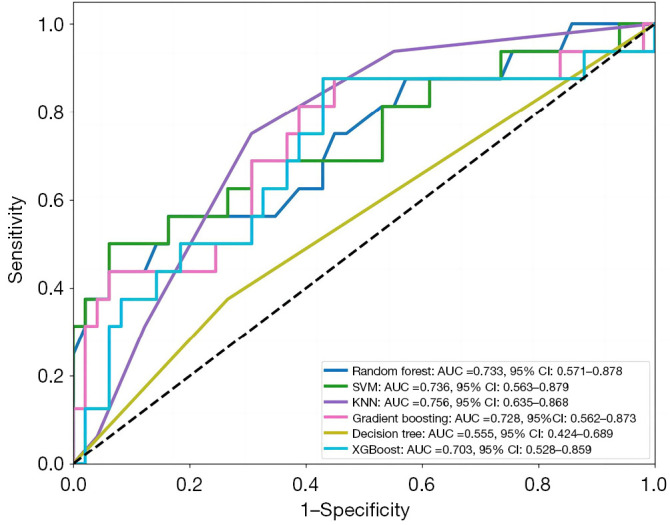
Results: After adjustment were made for various confounding factors such as comorbidities of AF, Cox regression showed that the volume of left atrial epicardial adipose tissue (LA-EAT), LA-EAT attenuation, left circumflex coronary artery fat attenuation index (LCX-FAI), and the TyG index were independent risk factors for recurrence after RFCA (P<0.001). The support vector machine (SVM) model based on these combined indicators had the best predictive performance, with an area under the curve of 0.793 [95% confidence interval (CI): 0.782-0.805] in the validation set, while its accuracy and positive predictive value were 0.804 and 0.710, respectively. The predictive efficiency of the TyG index appeared to be independent of type 2 diabetes mellitus (T2DM) status (Pinteraction=0.660).
Conclusions: The SVM model that integrated the TyG index and quantitative CT imaging variables demonstrated good predictive ability for post-RFCA recurrence in patients with AF. Furthermore, the TyG index appeared capable of predicting recurrence independently of T2DM status.
Keywords: Atrial fibrillation (AF); fat attenuation index (FAI); pericoronary adipose tissue (PCAT); radiofrequency catheter ablation (RFCA); triglyceride-glucose index (TyG index).
2024 AME Publishing Company. All rights reserved.
Conflict of interest statement
Conflicts of Interest: All authors have completed the ICMJE uniform disclosure form (available at https://qims.amegroups.com/article/view/10.21037/qims-24-1393/coif). A.S. is an employee of GE HealthCare China. The other authors have no conflicts of interest to declare.
Figures
Similar articles
-
The pre-ablation triglyceride-glucose index predicts late recurrence of atrial fibrillation after radiofrequency ablation in non-diabetic adults.BMC Cardiovasc Disord. 2022 May 14;22(1):219. doi: 10.1186/s12872-022-02657-y. BMC Cardiovasc Disord. 2022. PMID: 35568806 Free PMC article.
-
Association of pericoronary adipose tissue with atrial fibrillation recurrence after ablation based on computed tomographic angiography.Jpn J Radiol. 2023 Sep;41(9):955-964. doi: 10.1007/s11604-023-01426-x. Epub 2023 Apr 11. Jpn J Radiol. 2023. PMID: 37040024
-
Combination of Epicardial Adipose Tissue and Left Atrial Low-Voltage Areas Predicting Atrial Fibrillation Recurrence after Radiofrequency Ablation.Cardiology. 2025;150(1):48-55. doi: 10.1159/000540289. Epub 2024 Jul 25. Cardiology. 2025. PMID: 39053440
-
The predictive value of left atrium epicardial adipose tissue on recurrence after catheter ablation in patients with different types of atrial fibrillation.Int J Cardiol. 2023 May 15;379:33-39. doi: 10.1016/j.ijcard.2023.03.011. Epub 2023 Mar 8. Int J Cardiol. 2023. PMID: 36893857
-
Epicardial Adipose Tissue and Atrial Fibrillation Recurrence following Catheter Ablation: A Systematic Review and Meta-Analysis.J Clin Med. 2023 Oct 5;12(19):6369. doi: 10.3390/jcm12196369. J Clin Med. 2023. PMID: 37835012 Free PMC article. Review.
Cited by
-
Association Between Left Atrial Epicardial Adipose Tissue Attenuation Assessed by Cardiac Computed Tomography and Atrial Fibrillation Recurrence Following Catheter Ablation: A Systematic Review and Meta-Analysis.J Clin Med. 2025 Jul 6;14(13):4771. doi: 10.3390/jcm14134771. J Clin Med. 2025. PMID: 40649145 Free PMC article. Review.
References
-
- Wan P, Yu W, Zhai L, Qian B, Zhang F, Liu B, Wang J, Shao X, Shi Y, Jiang Q, Wang M, Shao S, Wang Y. The relationship between right atrial wall inflammation and poor prognosis of atrial fibrillation based on (18)F-FDG positron emission tomography/computed tomography. Quant Imaging Med Surg 2024;14:1369-82. 10.21037/qims-23-1129 - DOI - PMC - PubMed
LinkOut - more resources
Full Text Sources