. 2025 Mar 17;229(3):iyae211.
doi: 10.1093/genetics/iyae211.

Allele ages provide limited information about the strength of negative selection

Affiliations

Allele ages provide limited information about the strength of negative selection

Vivaswat Shastry et al. Genetics. .

Abstract

For many problems in population genetics, it is useful to characterize the distribution of fitness effects (DFE) of de novo mutations among a certain class of sites. A DFE is typically estimated by fitting an observed site frequency spectrum (SFS) to an expected SFS given a hypothesized distribution of selection coefficients and demographic history. The development of tools to infer gene trees from haplotype alignments, along with ancient DNA resources, provides us with additional information about the frequency trajectories of segregating mutations. Here, we ask how useful this additional information is for learning about the DFE, using the joint distribution on allele frequency and age to summarize information about the trajectory. To this end, we introduce an accurate and efficient numerical method for computing the density on the age of a segregating variant found at a given sample frequency, given the strength of selection and an arbitrarily complex population size history. We then use this framework to show that the unconditional age distribution of negatively selected alleles is very closely approximated by reweighting the neutral age distribution in terms of the negatively selected SFS, suggesting that allele ages provide little information about the DFE beyond that already contained in the present day frequency. To confirm this prediction, we extended the standard Poisson random field method to incorporate the joint distribution of frequency and age in estimating selection coefficients, and test its performance using simulations. We find that when the full SFS is observed and the true allele ages are known, including ages in the estimation provides only small increases in the accuracy of estimated selection coefficients. However, if only sites with frequencies above a certain threshold are observed, then the true ages can provide substantial information about the selection coefficients, especially when the selection coefficient is large. When ages are estimated from haplotype data using state-of-the-art tools, uncertainty about the age abrogates most of the additional information in the fully observed SFS case, while the neutral prior assumed in these tools when estimating ages induces a downward bias in the case of the thresholded SFS.

Keywords: ARG; DFE; MAF; frequency spectrum; genealogy.


Conflict of interest statement

Conflicts of interest: The author(s) declare no conflicts of interest.

Figures

Fig. 1.
Fig. 1.
Age distributions under different strengths of selection, conditional on segregating at a particular frequency in a diploid sample of n=125. For a particular sample frequency x, scaled selection coefficients less than 1/2x are shown in gray-scale, while the selection coefficients that are larger than this threshold are shown in color. a) Conditioning on i/2n=0.5%, b) Conditioning on i/2n=5%, and c) Conditioning on i/2n=50%.
Fig. 2.
Fig. 2.
The heatmap of KL divergence between the age density of alleles given a particular selection coefficient, P(ai,γ,n), and that of neutral alleles, P(ai,γ=0,n), conditional on the sample allele count i (Equation (7)). The black dashed line indicates the threshold, γ=1/2xγ=n/i, above which we expect the conditional age distribution of selected alleles to differ substantially from that of neutral alleles. Values in this figure are calculated for a diploid sample size of n=100, so a sample count i=100 corresponds to a sample frequency of 50%. Following the intuition from the text, an isocline of 0.3 reflects an approximately 2× increase in likelihood of the ages coming from a selected distribution than the neutral one. (See Supplementary Fig. S6 for the analog with total variation distance.)
Fig. 3.
Fig. 3.
The KL divergence between the unconditional age distributions of a particular selection coefficient (‘true’, Equation (10)) and the age distribution approximated by resampling from the neutral frequency spectrum (‘approx.’, Equation (9)) across a range of scaled selection coefficients. In a), we observe that for moderate negative selection (γ=20), the two distributions are very similar for young alleles and differ only for the oldest alleles of which there are very few. In b), for sites experiencing moderate positive selection (γ=20) the agreement between the true and approximated age distribution is much worse than for negative selection, particularly . In c), we plot the KL divergence between the true and approximated age distribution (Equation (7)) across a range of selection coefficients (see Supplementary Fig. S9 for an analog of this plot with total variation distance). a) γ=20, b) γ=20, and c) KL divergence DKL for γ[100,100].
Fig. 4.
Fig. 4.
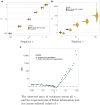
Selection coefficient estimation for a constant demographic history of N=10,000 using data simulated with PReFerSim (Ortega-Del Vecchyo et al. 2016) for a sample of n=100. a,b) Violin plots showing accuracy of estimation for different values of population-scaled selection coefficient γ using allele frequency & age data versus allele frequency alone. The X-axis shows different values of simulated γ, while the Y-axis shows the distribution on estimated γ^ over 100 independent replicates. The dashed horizontal lines denote the simulated values to aid in visualizing bias. On the negative side of the spectrum, we found that the MLE are close to the true value in both cases, with the approach including ages having slightly smaller error bars indicating more information about the selection coefficient in the data (especially for stronger values of selection). c) The ratio of variance (squared standard error) estimates (shown in black circles) calculated using Equation (19) from the frequency-only approach and the frequency & age approach for γ[100,100]. This tracks very closely with the expected ratio of Fisher information metrics (shown in green triangles, Equation (18)) for selected values of γ across the range. a) Negative γ, b) Positive γ, and c) The observed ratio of variances across all γ and the expected ratio of Fisher information metrics across selected values of γ.
Fig. 5.
Fig. 5.
Selection coefficient estimation for neutrality and negative selection for a constant demographic history of N=10,000 using data simulated with PReFerSim (Ortega-Del Vecchyo et al. 2016) under two different schemes: large sample of n=100 but only using sites with MAF 2.5% and a small sample of n=10 but using all segregating sites. a) Violin plots showing the distribution of estimates across replicates under the two schemes, with or without ages. Estimates from both approaches (and both schemes) are similarly unbiased across the entire tested range. b) Ratio of variances and a loess fit (similar to Fig. 4c) to illustrate the gain in information due to including ages when there is a threshold on the SFS (with a sample of n=10, observing a singleton is akin to imposing an MAF 5% threshold). In the case with the larger sample size, we observe a significant increase in information gain (compared with observing all sites) for |γ|>1/(2×0.025)=20 (indicated by the dashed line). Similarly, in the case of the smaller sample, conditioning on segregation (i.e. observing 1/20) is the same as applying an MAF threshold, we see a significant increase in information gain for |γ|>1/2×0.05=10 (indicated by the solid line).
Fig. 6.
Fig. 6.
Selection coefficient estimation accuracy for neutrality and negative selection under a constant demographic history with N=10,000 using data simulated using PReFerSim (Ortega-Del Vecchyo et al. 2016) and haplotypes simulated using mssel (Hudson 2002), and ages estimated using Relate (Speidel et al. 2019) for a sample of n=100. a) Using sites at all frequencies and raw age estimates from Relate, estimated selection coefficient are biased toward zero due to the neutral coalescent prior. However, this bias is eliminated by averaging over the density on age on the branch which it arose versus using the point estimate from Relate. b) However, uncertainty in the age estimates (i.e. increase in length of estimated branches) also erases nearly all of the additional information gained by including age estimates. c) When using the SFS thresholded at MAF 2.5%, estimates using the age density averages across the estimated branch also become biased, especially for larger scaled selection coefficients. d) Despite the bias seen in panel c, including ages still substantially reduces the variance of the estimates when the SFS is thresholded and ages are estimated using Relate. a) MLE using all sites, b) Ratio of variances using all sites, c) MLE using only sites with MAF 2.5%, and d) Ratio of variances using only sites with MAF 2.5%.

Similar articles

References

    1. Adrion JR, Cole CB, Dukler N, Galloway JG, Gladstein AL, Gower G, Kyriazis CC, Ragsdale AP, Tsambos G, Baumdicker F, et al. . 2020. A community-maintained standard library of population genetic models. Elife. 9:e54967. 10.7554/eLife.54967 - DOI - PMC - PubMed
    1. Albers PK, McVean G. 2020. Dating genomic variants and shared ancestry in population-scale sequencing data. PLoS Biol. 18(1):e3000586. 10.1371/journal.pbio.3000586 - DOI - PMC - PubMed
    1. Bataillon T, Bailey SF. 2014. Effects of new mutations on fitness: insights from models and data. Ann N Y Acad Sci. 1320(1):76–92. 10.1111/nyas.2014.1320.issue-1 - DOI - PMC - PubMed
    1. Blumenstiel JP, Chen X, He M, Bergman CM. 2014. An age-of-allele test of neutrality for transposable element insertions. GENETICS. 196(2):523–538. 10.1534/genetics.113.158147 - DOI - PMC - PubMed
    1. Bollback JP, York TL, Nielsen R. 2008. Estimation of 2Nes from temporal allele frequency data. GENETICS. 179(1):497–502. 10.1534/genetics.107.085019 - DOI - PMC - PubMed

LinkOut - more resources