. 2025 Feb;12(6):e2407888.
doi: 10.1002/advs.202407888. Epub 2024 Dec 19.

Triboelectric Mat Multimodal Sensing System (TMMSS) Enhanced by Infrared Image Perception for Sleep and Emotion-Relevant Activity Monitoring

Affiliations

Triboelectric Mat Multimodal Sensing System (TMMSS) Enhanced by Infrared Image Perception for Sleep and Emotion-Relevant Activity Monitoring

Jinlong Xu et al. Adv Sci (Weinh). 2025 Feb.

Abstract

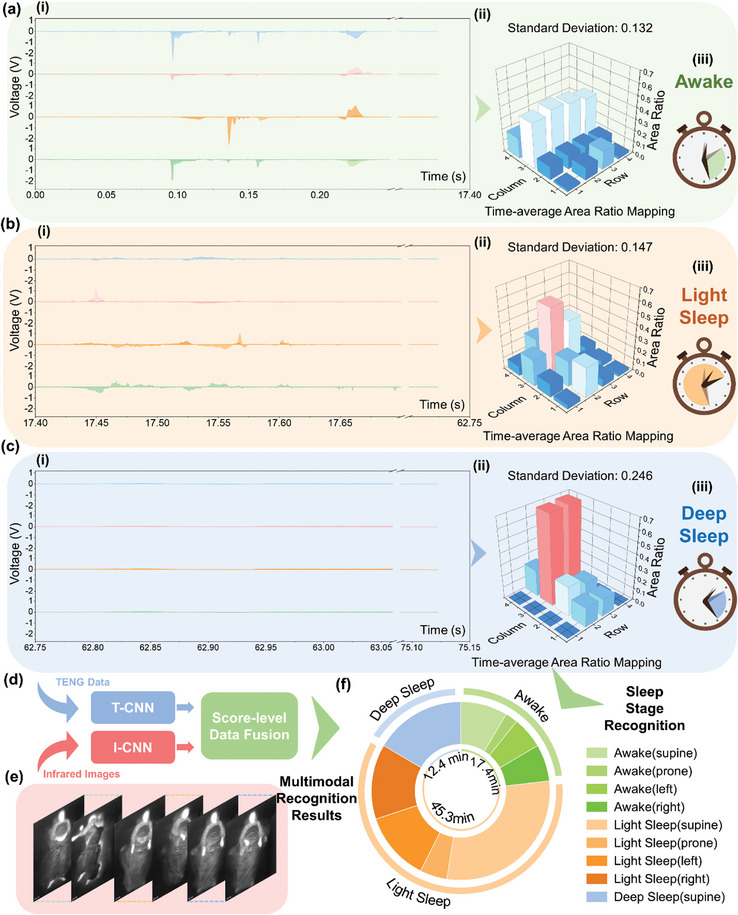
To implement digital-twin smart home applications, the mat sensing system based on triboelectric sensors is commonly used for gait information collection from daily activities. Yet traditional mat sensing systems often miss upper body motions and fail to adequately project these into the virtual realm, limiting their specific application scenarios. Herein, triboelectric mat multimodal sensing system is designed, enhanced with a commercial infrared imaging sensor, to capture diverse sensory information for sleep and emotion-relevant activity monitoring without compromising privacy. This system generates pixel-based area ratio mappings across the entire mat array, solely based on the integral operation of triboelectric outputs. Additionally, it utilizes multimodal sensory intelligence and deep-learning analytics to detect different sleeping postures and monitor comprehensive sleep behaviors and emotional states associated with daily activities. These behaviors are projected into the metaverse, enhancing virtual interactions. This multimodal sensing system, cost-effective and non-intrusive, serves as a functional interface for diverse digital-twin smart home applications such as healthcare, sports monitoring, and security.

Keywords: deep learning; digital twin; multimodality; smart home; triboelectric sensor.


Conflict of interest statement

The authors declare no conflict of interest.

Figures

Figure 1
Figure 1
An overview of the triboelectric mat multimodal sensing system (TMMSS) enabled by the integration of a triboelectric mat array and a commercial infrared imaging sensor. a) The schematic of TMMSS equipped with artificial intelligence for various potential applications. b) The illustration of TMMSS layout in some scenarios (smart healthcare, smart gym, and smart office) in smart homes. c) Schematic of TMMSS equipped with the multimodal infrared and triboelectric mat sensors exhibiting unobtrusive cognitive capability for various smart home applications. d) The detailed structure diagram of one triboelectric mat pixel with its precise dimension in Figure S3 (Supporting Information). e) Working principles of triboelectric mat sensor implementation: touch drives and free electron flow. f) The robust triboelectric outputs (Figure S1, Supporting Information) are directly generated by the triboelectric mat array. g) The integral values of the triboelectric voltage. h) The corresponding pixel‐based area ratio mapping by triboelectric data. i) The multimodal convolutional neural network (CNN) for triboelectric and thermal data analysis. j) The thermal images captured by an infrared imaging sensor when the user is on the bed.
Figure 2
Figure 2
Investigation of the electrode connection of triboelectric mat for position sensing and action recognition. a) The schematic diagram of the separate connection of 4 mats into 8 electrodes. b,c) The generated output voltages and corresponding negative peak‐to‐peak voltage ratio with 4 steps. Subsequently, the classification of different mat pixels is achieved by calculating the voltage ratio and comparing it with the predetermined voltage ratio threshold (Figure S4, Supporting Information). d) The schematic diagram of the interval parallel connection of 4 mats into 4 electrodes. e,f) The generated output voltages and corresponding negative peak‐to‐peak voltage ratio with 4 steps. Subsequently, the identification of the mat pixels with different voltage ratios is similarly achieved using the pre‐calculated voltage ratio thresholds (Figure S4, Supporting Information). g) The schematic diagram of the constructed 4 × 4 pixels‐mat array with 8 output channels (detailed wiring configurations in Figure S5d, Supporting Information). The practical photo of the mat array is illustrated in Figure S6 (Supporting Information). h) Voltage output for different motions (sit, lie, walk, jump, run, lie rightward, lie leftward, and prone) generated by mat array. i) The t‐SNE results of the TENG signal from 8 channels’ mat array. j) Confusion map of recognizing 8 motions for 8 channels’ mat array using a 4‐layer CNN structure (Figure S7, Supporting Information). k) The bar graph illustrating the accuracy of recognizing 8 different motions using a 4×4 pixel matrix with various output channel wiring strategies (the detailed wiring connections in Figure S5, Supporting Information). The corresponding confusion maps are depicted in Figure S8 (Supporting Information).
Figure 3
Figure 3
The illustration of triboelectric mat array for sleep position monitoring and area mapping. a) Computational approaches to achieve pixel‐based area ratio mapping. b) The explanation of the principle for calculating the voltage integral in area‐proportional mapping, using a mat pixel with a voltage ratio of 2:8. As illustrated in Figure S9 (Supporting Information) and detailed in Note S2 (Supporting Information), the integrated negative voltage when the contact remains on the entire mat is calculated to be Γmin = −33 V·s, indicating a direct proportionality to the charge transfer. We then use different colors to represent the distinctions between various area ratios, which correspond to the voltage integration ratio. c,d) Progressive demonstration of a man lying down and corresponding outputs and area‐ratio mapping using the same methodology. e,f) The triboelectric outputs of 4 kinds of sleep postures (supine, lie leftward, prone, and lie rightward) and the corresponding demonstration of human actions. g,h) The area ratio of 4 kinds of sleep postures and the corresponding demonstration of area‐ratio mapping diagrams. For the first sleeping posture (supine), the voltage ratio mapping can be directly calculated using the voltage ratio threshold. For the remaining three sleeping postures, since the user presses on two mats with the same output port simultaneously, the voltage ratio mapping can be obtained through matrix operations based on the calculation method described in Note S3 (Supporting Information).
Figure 4
Figure 4
The TMMSS with sensory intelligence and data fusion analytics for sleep posture estimation under thick bedcovers. a) Thermal images for 4 sleep postures of 3 users captured by a commercial infrared imaging sensor for sleep posture estimation without privacy concerns. b) Corresponding triboelectric outputs generated by the triboelectric mat array. c) t‐SNE diagrams of i) thermal data only, ii) triboelectric information only, and iii) multimodal data. d) Sleep posture recognition results of i) infrared data only (detailed network structure in Figure S10, Supporting Information), ii) triboelectric data only (detailed network structure in Figure S11, Supporting Information), and iii) multimodal data. e) The simplified architecture of the multimodal network (detailed multimodal CNN structure for data fusion in Figure S12, Supporting Information) for i) feature‐level and ii) score‐level fusion of the thermal and triboelectric information. f) The recognition performance comparison of thermal data only, triboelectric information only, feature‐level fusion, and score‐level fusion. The confusion maps of feature‐level and weighted score‐level data fusion are illustrated in Figure S13 (Supporting Information).
Figure 5
Figure 5
Demonstration of TMMSS in the application of a sleep monitoring interface. a) i) The triboelectric outputs generated by the mat array, ii) corresponding time‐average area‐ratio mappings (The detailed calculation principle of 3D diagram is depicted in Figure S14, Supporting Information) iii) from 0:10 AM to 0:27 AM. b) i) The triboelectric outputs generated by the mat array and ii) corresponding time‐average area‐ratio mapping iii) from 0:27 AM to 1:12 AM. c) i) The triboelectric outputs generated by the mat array and ii) corresponding time‐average area‐ratio mapping iii) from 1:12 AM to 1:25 AM. d) Simplified architecture for score‐level data fusion. e) Thermal images captured by the infrared imaging sensor from 0:10 AM to 1:25 AM (Figure S15–S17, Supporting Information). f) Comprehensive sleep monitoring diagram of the user's graphical interface. The time distribution for 4 sleep postures during different stages in one sleep cycle is detected in Figure S18 (Supporting Information). Finally, a more advanced sleep monitoring diagram can be generated containing the time distribution of all sleep stages in one cycle and 4 sleep postures (supine, prone, left, and right) in each sleep stage.
Figure 6
Figure 6
The TMMSS for digital‐twin smart home applications. a) Thermal images of 20 behaviors captured by the infrared imaging sensor in a fixed location. These images display the temperature distribution and capture the movements of the upper body. b) The triboelectric voltage of 20 behaviors produced by the triboelectric mat array. These results involve users' gait information. c) Behavior recognition results for thermal data only. The corresponding t‐SNE diagram is shown in Figure S19a (Supporting Information). d) Behavior recognition results for triboelectric information only. The t‐SNE diagram is shown in Figure S19b (Supporting Information). e) Behavior recognition results of multimodal data fusion analytics (detailed parameters of the multimodal CNN networks in Figure S20, Supporting Information). The t‐SNE diagram is shown in Figure S19c (Supporting Information). f–h)Demonstration of different behaviors (“read”, “angry”, and “anxious”), where the user is in the TMMSS, while his digital twin is controlled in virtual space accordingly. Therefore, the TMMSS can accurately distinguish these emotional‐relevant behaviors (“angry” and “anxious”) and enable a digital‐twin projection in virtual space.

Similar articles

Cited by

References

    1. Luo Y., Abidian M. R., Ahn J. H., Akinwande D., Andrews A. M., Antonietti M., Bao Z., Berggren M., Berkey C. A., Bettinger C. J., Chen J., Chen P., Cheng W., Cheng X., Choi S. J., Chortos A., Dagdeviren C., Dauskardt R. H., Di C. A., Dickey M. D., Duan X., Facchetti A., Fan Z., Fang Y., Feng J., Feng X., Gao H., Gao W., Gong X., Guo C. F., et al., ACS Nano 2023, 17, 5211. - PMC - PubMed
    1. Liu Y., Chen M., Chan C., yin Chan H., Wang J., Yu X., Li X., Li W. J., Adv. Intell. Syst. 2023, 5, 202200220.
    1. Suo J., Liu Y., Wang J., Chen M., Wang K., Yang X., Yao K., Roy V. A. L., Yu X., Daoud W. A., Liu N., Wang J., Wang Z., Li W. J., Adv. Sci. 2024, 2305025, 1. - PMC - PubMed
    1. Xi Y., Tan P., Li Z., Fan Y., Soft Sci. 2023, 3, 13.
    1. Zhu M., Sun Z., Chen T., Lee C., Nat. Commun. 2021, 12, 1. - PMC - PubMed

LinkOut - more resources