. 2024 Dec 19:41:E007.
doi: 10.1017/S095252382400004X.

Visual Field Asymmetries in Responses to ON and OFF Pathway Biasing Stimuli

Affiliations

Visual Field Asymmetries in Responses to ON and OFF Pathway Biasing Stimuli

Martin Timothy Wilkinson Scott et al. Vis Neurosci. .

Abstract

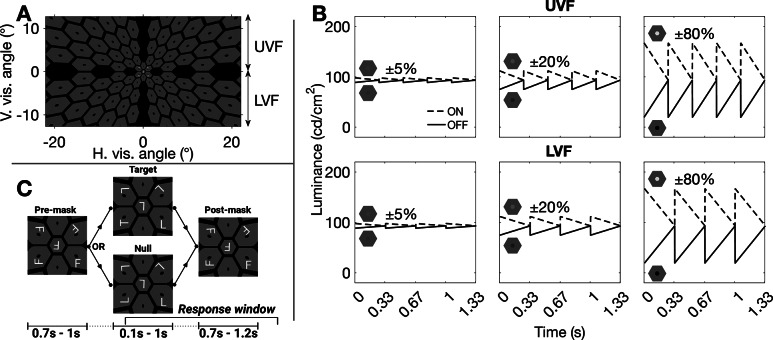
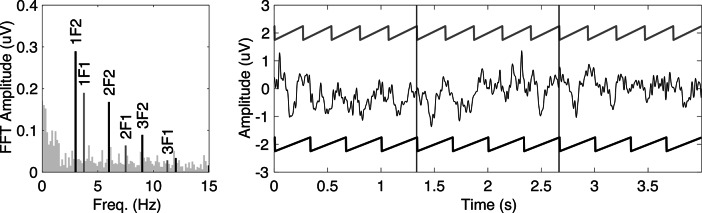
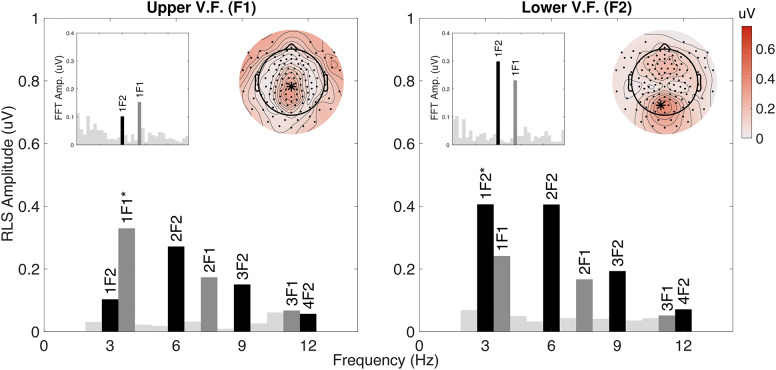
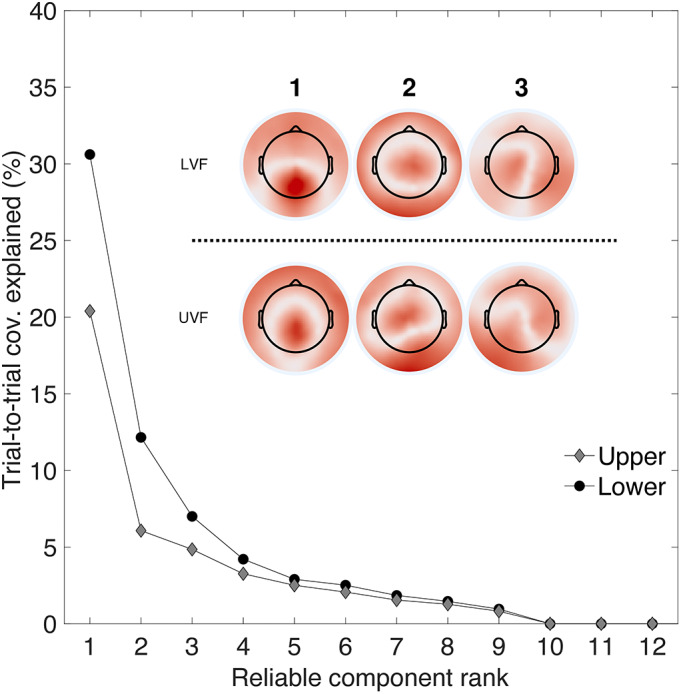
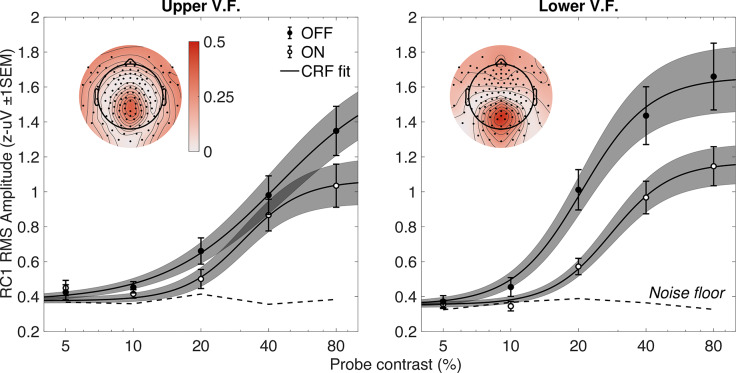
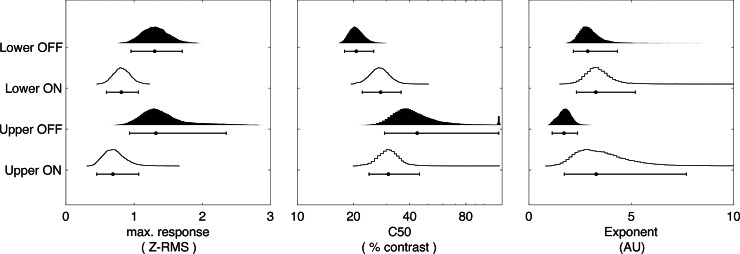
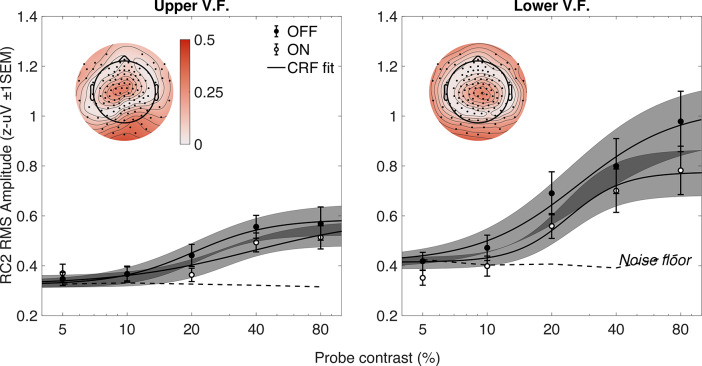
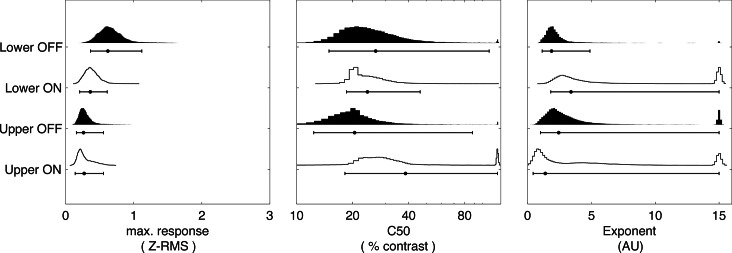
Recent reports suggest the ON and OFF pathways are differentially susceptible to selective vision loss in glaucoma. Thus, perimetric assessment of ON- and OFF-pathway function may serve as a useful diagnostic. However, this necessitates a developed understanding of normal ON/OFF pathway function around the visual field and as a function of input intensity. Here, using electroencephalography, we measured ON- and OFF-pathway biased contrast response functions in the upper and lower visual fields. Using the steady-state visually evoked potential paradigm, we flickered achromatic luminance probes according to a saw-tooth waveform, the fast phase of which biased responses towards the ON or OFF pathways. Neural responses from the upper and lower visual fields were simultaneously measured using frequency tagging - probes in the upper visual field modulated at 3.75 Hz, while those in the lower visual field modulated at 3 Hz. We find that responses to OFF/decrements are larger than ON/increments, especially in the lower visual field. In the lower visual field, both ON and OFF responses were well described by a sigmoidal non-linearity. In the upper visual field, the ON pathway function was very similar to that of the lower, but the OFF pathway function showed reduced saturation and more cross-subject variability. Overall, this demonstrates that the relationship between the ON and OFF pathways depends on the visual field location and contrast level, potentially reflective of natural scene statistics.

Keywords: ON/OFF pathways; luminance contrast; sawtooth stimuli; visual evoked potential; visual fields.


Figures

Figure 1.
Figure 1.
A single frame of the hexagonal stimulus array at 80% OFF contrast (A). The luminance of the central probes is varied to bias responses to the ON or OFF pathways at different Weber contrasts. The temporal frequency of the saw-tooth stimulus was different for the UVF and LVF, which allows for the spectral decomposition of these signals (B). A schematic overview of a single trial of the concurrent attention task (C).
Figure 2.
Figure 2.
Frequency domain (left panel) representation of the average (N = 21) response to an 80% OFF-contrast flicker at channel 75 (approx. occiptial pole) for 6.6 s of data. The stimulus related frequencies are labelled up to the 3rd harmonic. The right panel is the time-domain representation of the same data, but the x-axis has been limited to 4 s to aid visualisation. Each vertical reference line shows the time at which an integer number of stimulus cycles were completed for both stimulation frequencies (see the reference saw-teeth at 3 Hz (LVF) and 3.75 Hz (UVF)).
Figure 3.
Figure 3.
Grand-average (N = 21) RLS spectra for two channels with maximum RLS-amplitude at fundamental stimulation frequencies. Data shown are responses to 80% contrast OFF-biasing modulation. The spectrum in the left panel is for channel 55 (max. for 1F1/UVF), while the right panel is for channel 71 (max, for 1F2/LVF). Bars colored grey and black highlight the frequencies related to the UVF and LVF, respectively. The lighter-gray bars are non-stimulus frequencies. The inlaid axes of each panel show higher-resolution FFT spectra (left inlay) and RLS topographies of the fundamental frequencies used in the experiment with the peak sensor highlighted by an asterisk (as is the generative spectral peak) (right inlay).
Figure 4.
Figure 4.
Scree plot showing the trial-to-trial covariance explained by the first 12 reliable components for the upper (diamonds) and lower (circles) visual fields. Inlaid topographies show the forward model projections of the first 3 components, plotted on the same color-scale (the units are arbitrary).
Figure 5.
Figure 5.
Group-level (N = 21) RC1 Topographies and contrast response functions. Shaded regions illustrate 68% confidence intervals on the model fit to the empirical mean. Error bars are 68% confidence intervals on the empirical mean response for a given contrast. The units on the color-bar are micro-volts.
Figure 6.
Figure 6.
Half-violin plots showing parameter estimates produced by the group level fit bootstrapping procedure for RC1. Histograms have been color-coded by the pathway being biased (White = ON, Black = OFF). The parameter displayed in each sub-plot is shown in the x-axis labels.
Figure 7.
Figure 7.
Group-level (N = 21) RC2 Topographies and contrast response functions. Shaded regions illustrate 68% confidence intervals on the model fit to the empirical mean. Error bars are 68% confidence intervals on the empirical mean response for a given contrast. The units on the color-bar are micro-volts.
Figure 8.
Figure 8.
Half-violin plots showing parameter estimates produced by the group level fit bootstrapping procedure for RC2. Histograms have been color-coded by the pathway being biased (White = ON, Black = OFF). The parameter displayed in each sub-plot is shown in the x-axis labels.

Similar articles

Cited by

References

    1. Abballe, L. & Asari, H. (2022). Natural image statistics for mouse vision. PLoS One 17(Suppl. 1), e0262763. - PMC - PubMed
    1. Abrams, J., Nizam, A., & Carrasco, M. (2012). Isoeccentric locations are not equivalent: The extent of the vertical meridian asymmetry. Vision Research 52(Suppl. 1), 70–78. - PMC - PubMed
    1. Albrecht, D.G. & Hamilton, D.B. (1982). Striate cortex of monkey and cat: Contrast response function. Journal of Neurophysiology 48(Suppl. 1), 217–237. - PubMed
    1. Ales, J.M., Yates, J.L., & Norcia, A.M. (2010). V1 is not uniquely identified by polarity reversals of responses to upper and lower visual field stimuli. NeuroImage 52(Suppl. 4), 1401–1409. - PMC - PubMed
    1. Anderson, A.J. & Vingrys, A.J. (2000). Interactions between flicker thresholds and luminance pedestals. Vision Research 40(Suppl. 19), 2579–2588. - PubMed

Publication types

LinkOut - more resources