

The influence of post-glacial migration and hybridization on the gene pool of marginal Quercus pubescens populations in Central Europe
- PMID: 39699027
- PMCID: PMC12064428
- DOI: 10.1093/aob/mcae216
The influence of post-glacial migration and hybridization on the gene pool of marginal Quercus pubescens populations in Central Europe
Abstract
Background and aims: In Central Europe, the drought-tolerant downy oak (Quercus pubescens) is at the northern edge of its natural distribution range, often growing in small and spatially isolated populations. Here, we elucidate how the population genetic structure of Central European Q. pubescens was shaped by geographical barriers, genetic drift and introgression with the closely related sessile oak (Q. petraea).
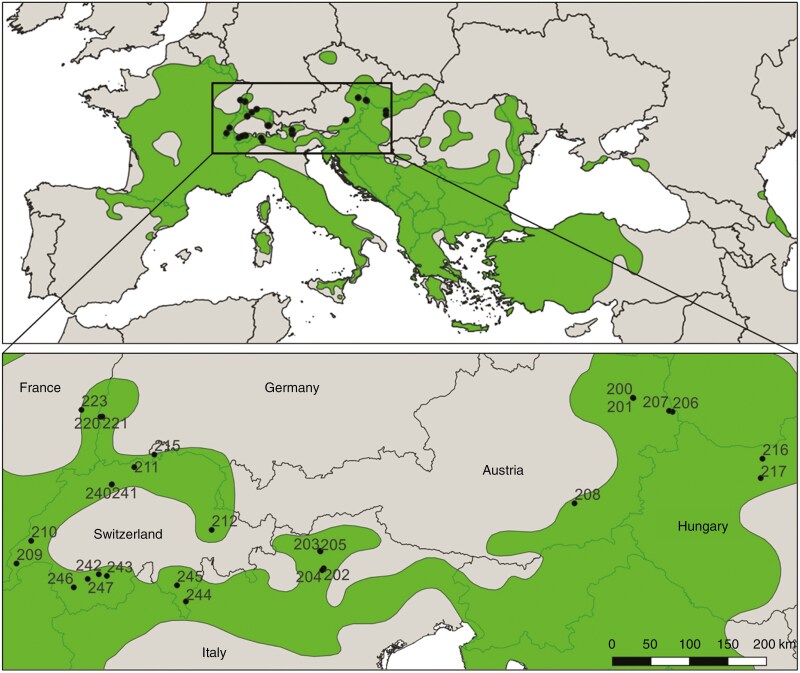
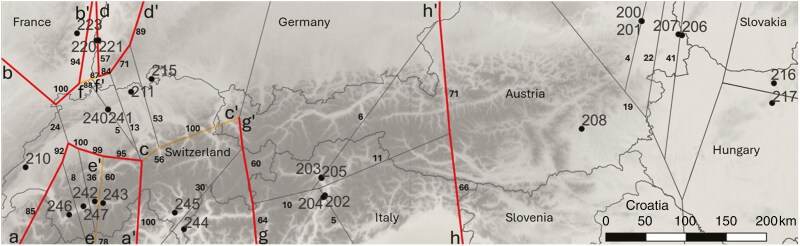
Methods: In total, 27 Q. pubescens populations from the northern margin of its natural distribution range were sampled. Based on 16 nuclear microsatellite markers (nSSRs), Bayesian clustering and distance-based analyses were performed to determine the intraspecific genetic structure and to identify genetic barriers. To identify drivers of introgression with Q. petraea, generalized linear models were applied to link levels of introgression with environmental conditions. To track post-glacial migration routes, the spatial distribution of haplotypes based on eight chloroplast microsatellite markers (cpSSRs) was investigated.
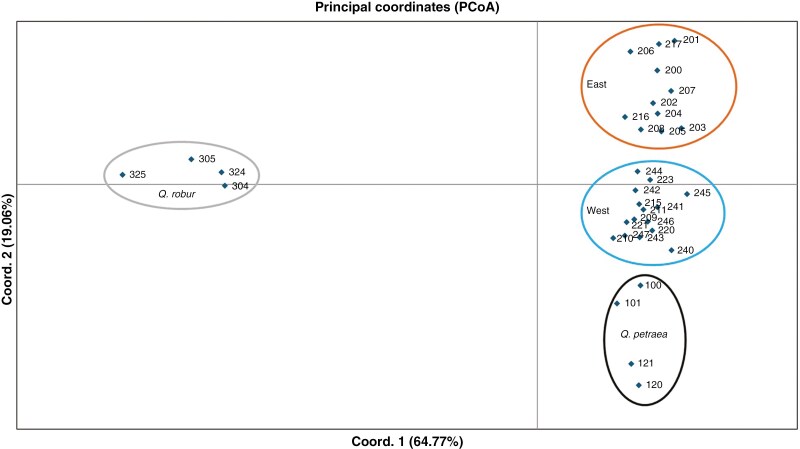
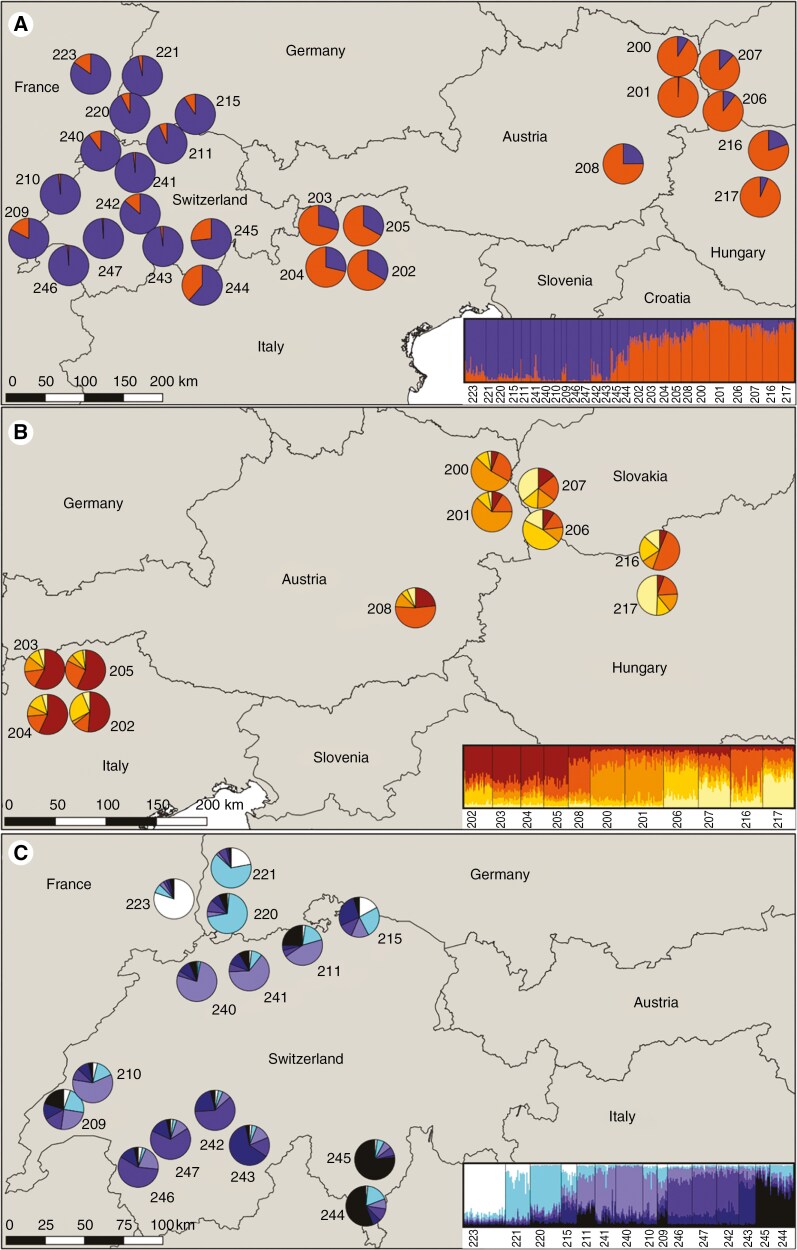
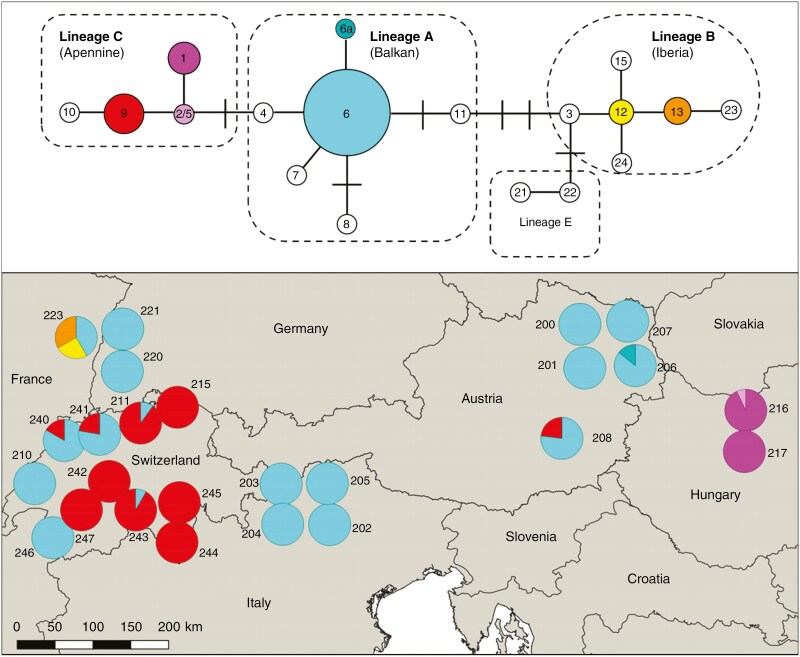
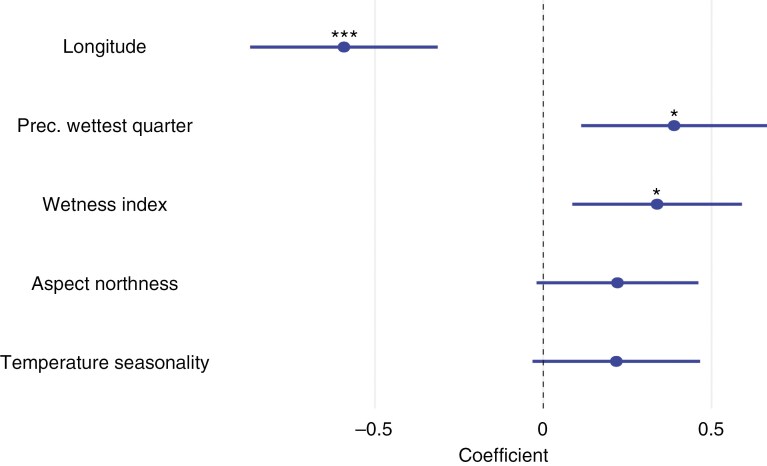
Key results: Based on nSSRs, the study populations of Q. pubescens were divided into a western and an eastern genetic cluster. Within these clusters, more pronounced genetic substructure was observed in the west, probably due to a rugged topography and limited gene flow. Introgression from Q. petraea was more prevalent at wetter and north-exposed sites and in the west. The identified cpSSR haplotypes followed known migration pathways.
Conclusions: Our results suggest two late-glacial refugia in or near the southwestern Alps and the southeastern Alps as potential sources for post-glacial migration. Although some genetic exchange is evident in northern Italy, south of the Alps, the two clusters remain distinct at a large scale. Landscape features and introgression with Q. petraea shaped the genetic substructure at a smaller scale. Our study provides a comprehensive overview of the genetic structure of Q. pubescens in Central Europe, relevant for conservation.
Keywords: Quercus pubescens; downy oak; genetic differentiation; genetic diversity; haplotype; hybridization; introgression; microsatellites; peripheral populations; short sequence repeats; white oaks.
© The Author(s) 2024. Published by Oxford University Press on behalf of the Annals of Botany Company.
Figures

References
-
- Aldrich P, Michler C, Sun W, Romero-Severson J.. 2002. Microsatellite markers for northern red oak (Fagaceae: Quercus rubra). Molecular Ecology Notes 2: 472–474. doi: https://doi.org/10.1046/j.1471-8286.2002.00282.x - DOI
-
- Antonecchia G, Fortini P, Lepais O, et al.2015. Genetic structure of a natural oak community in central Italy: Evidence of gene flow between three sympatric white oak species (Quercus, Fagaceae). Annals of Forest Research 57: 1. doi: https://doi.org/10.15287/afr.2015.415 - DOI
-
- Arnold ML. 1997. Natural hybridization and evolution. Oxford: Oxford University Press.
-
- Barbero M. 1978. Les remontées méditerranéennes sur le versant italien des Alpes. Ecologia Mediterranea 4: 109–132. doi: https://doi.org/10.3406/ecmed.1978.947 - DOI
-
- Bartos M. 2020. PHYSHEDS: simple and fast watershed deliniation in phyton (version 0.4) [computer software]. GitHub Respiratory. doi:10.5281/ZENODO.3822494 - DOI
MeSH terms
Grants and funding
LinkOut - more resources
Full Text Sources
Other Literature Sources
