

Population pharmacokinetics of piperacillin-tazobactam in the plasma and cerebrospinal fluid of critically ill patients
- PMID: 39699210
- PMCID: PMC11823673
- DOI: 10.1128/aac.00601-24
Population pharmacokinetics of piperacillin-tazobactam in the plasma and cerebrospinal fluid of critically ill patients
Abstract
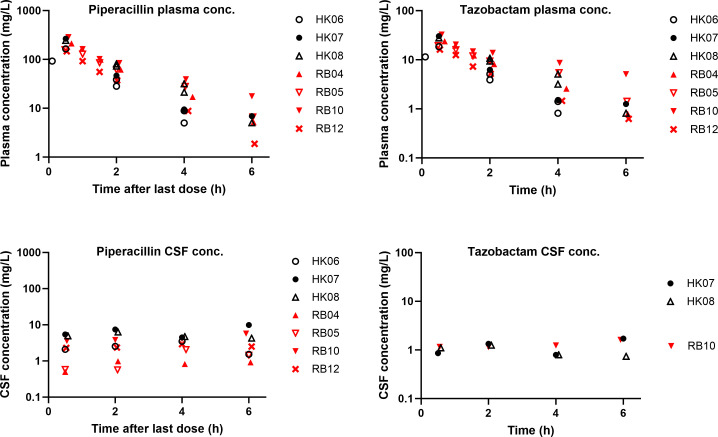
Ventriculitis in neurocritical care patients leads to significant morbidity and mortality. Antibiotic dose optimization targeting pharmacokinetic/pharmacodynamic (PK/PD) exposures associated with improved bacterial killing may improve therapeutic outcomes. We sought to develop and apply a population PK model in infected critically ill patients to determine optimal piperacillin-tazobactam (PTZ) dosing regimens to achieve target cerebrospinal fluid (CSF) exposures. Neurosurgical patients with external ventricular drains and receiving PTZ treatment were recruited and had plasma and CSF samples collected and assayed. A population PK model was developed using plasma and CSF piperacillin and tazobactam concentrations. Eight patients were recruited. Median age was 59 years, median weight was 70 kg, and five patients were female. The median creatinine clearance was 84 mL/min/1.73 m2 (range 52-163). Substantial inter-individual PK variability was apparent, particularly in CSF. Piperacillin penetration into CSF had a median of 3.73% (range 0.73%-7.66%), and tazobactam CSF penetration was not predictable. Dosing recommendations to optimize CSF exposures for the treatment of ventriculitis were not possible due to substantial PK variability and very low drug penetration. High plasma PTZ exposures may not translate to effective exposures in CSF.
Keywords: antibiotics; cerebrospinal fluid; critical illness; pharmacokinetic/pharmacodynamic; piperacillin-tazobactam; ventriculitis; ventriculostomy-associated infection.
Conflict of interest statement
The authors declare no conflict of interest.
Figures


References
-
- Abdul-Aziz MH, Alffenaar J-WC, Bassetti M, Bracht H, Dimopoulos G, Marriott D, Neely MN, Paiva J-A, Pea F, Sjovall F, Timsit JF, Udy AA, Wicha SG, Zeitlinger M, De Waele JJ, Roberts JA, Infection Section of European Society of Intensive Care Medicine (ESICM), Pharmacokinetic/pharmacodynamic and Critically Ill Patient Study Groups of European Society of Clinical Microbiology and Infectious Diseases (ESCMID), Infectious Diseases Group of International Association of Therapeutic Drug Monitoring and Clinical Toxicology (IATDMCT), Infections in the ICU and Sepsis Working Group of International Society of Antimicrobial Chemotherapy (ISAC) . 2020. Antimicrobial therapeutic drug monitoring in critically ill adult patients: a position paper Intensive Care Med 46:1127–1153. doi: 10.1007/s00134-020-06050-1 - DOI - PMC - PubMed
-
- McKinnon PS, Paladino JA, Schentag JJ. 2008. Evaluation of area under the inhibitory curve (AUIC) and time above the minimum inhibitory concentration (T>MIC) as predictors of outcome for cefepime and ceftazidime in serious bacterial infections. Int J Antimicrob Agents 31:345–351. doi: 10.1016/j.ijantimicag.2007.12.009 - DOI - PubMed
Publication types
MeSH terms
Substances
Grants and funding
LinkOut - more resources
Full Text Sources
Medical
