

In vitro resensitization of multidrug-resistant clinical isolates of Enterococcus faecium and E. faecalis through phage-antibiotic synergy
- PMID: 39699213
- PMCID: PMC11823633
- DOI: 10.1128/aac.00740-24
In vitro resensitization of multidrug-resistant clinical isolates of Enterococcus faecium and E. faecalis through phage-antibiotic synergy
Abstract
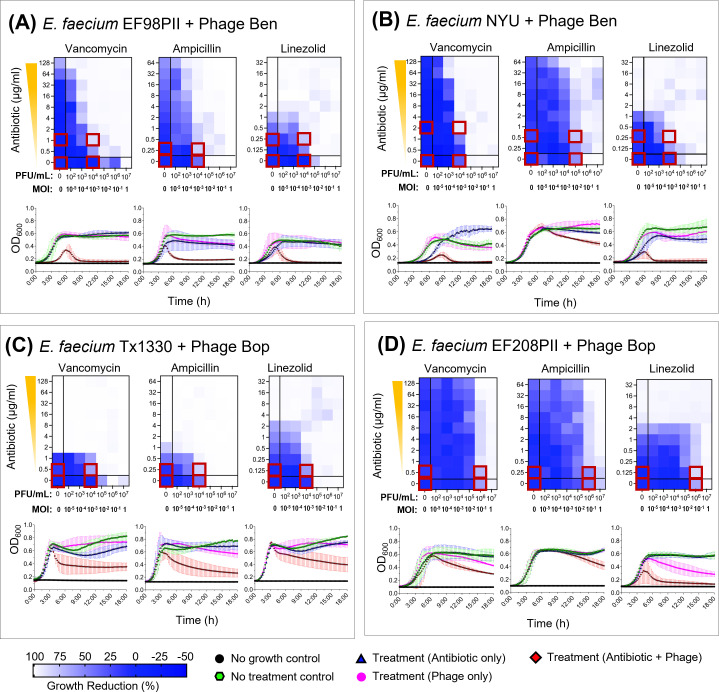
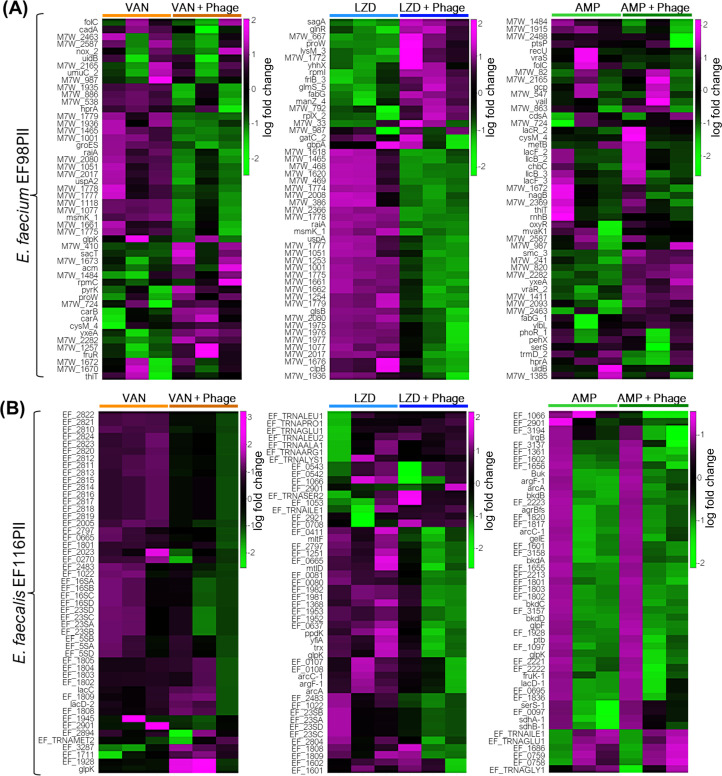
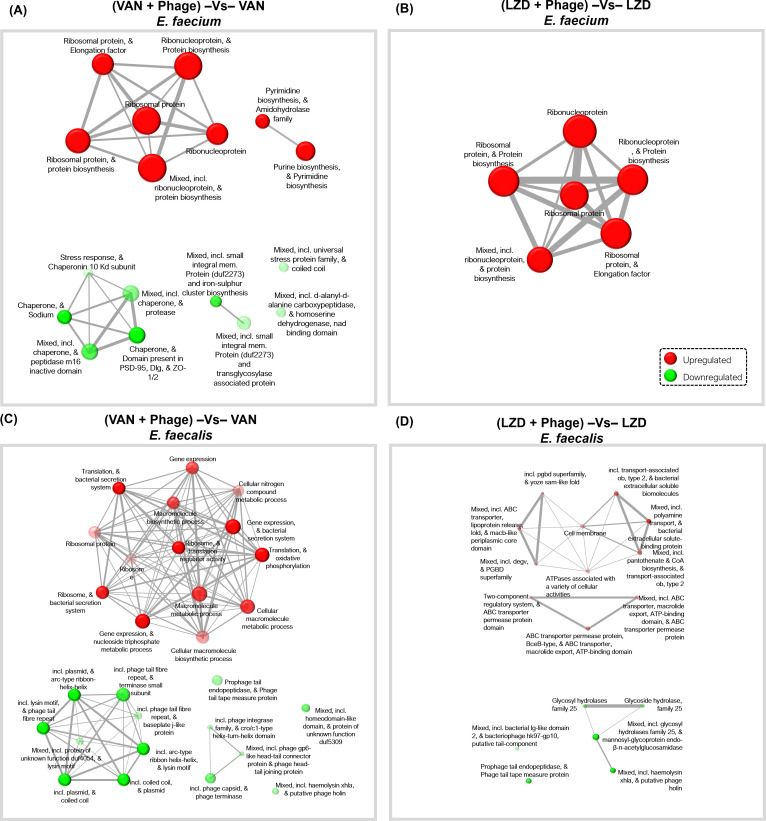
Bacteriophages are an increasingly attractive option for the treatment of antibiotic-resistant infections, but their efficacy is difficult to discern due to the confounding effects of antibiotics. Phages are generally delivered in conjunction with antibiotics, and thus, when patients improve, it is unclear whether the phages, antibiotics, or both are responsible. This question is particularly relevant for enterococcus infections, as limited data suggest phages might restore antibiotic efficacy against resistant strains. Enterococci can develop high-level resistance to vancomycin, a primary treatment. We assessed clinical and laboratory isolates of Enterococcus faecium and Enterococcus faecalis to determine whether we could observe synergistic interactions between phages and antibiotics. We identified synergy between multiple phages and antibiotics including linezolid, ampicillin, and vancomycin. Notably, antibiotic susceptibility did not predict synergistic interactions with phages. Vancomycin-resistant isolates (n = 6) were eradicated by the vancomycin-phage combination as effectively as vancomycin-susceptible isolates (n = 2). Transcriptome analysis revealed significant gene expression changes under antibiotic-phage conditions, especially for linezolid and vancomycin, with upregulated genes involved in nucleotide and protein biosynthesis and downregulated stress response and prophage-related genes. While our results do not conclusively determine the mechanism of the observed synergistic interactions between antibiotics and phages, they do confirm and build upon previous research that observed these synergistic interactions. Our work highlights how using phages can restore the effectiveness of vancomycin against resistant isolates. This finding provides a promising, although unexpected, strategy for moving forward with phage treatments for vancomycin-resistant Enterococcus infections.
Keywords: antibiotics; bacteriophages; cooperativity; resensitization; synergy.
Conflict of interest statement
The authors declare no conflict of interest.
Figures


Similar articles
-
Analysis of molecular epidemiological characteristics and antimicrobial susceptibility of vancomycin-resistant and linezolid-resistant Enterococcus in China.BMC Med Genomics. 2024 Jul 1;17(1):174. doi: 10.1186/s12920-024-01948-x. BMC Med Genomics. 2024. PMID: 38951840 Free PMC article.
-
Sentinel Surveillance reveals phylogenetic diversity and detection of linear plasmids harboring vanA and optrA among enterococci collected in the United States.Antimicrob Agents Chemother. 2024 Nov 6;68(11):e0059124. doi: 10.1128/aac.00591-24. Epub 2024 Oct 15. Antimicrob Agents Chemother. 2024. PMID: 39404260 Free PMC article.
-
Bacteriophage Resistance Alters Antibiotic-Mediated Intestinal Expansion of Enterococci.Infect Immun. 2019 May 21;87(6):e00085-19. doi: 10.1128/IAI.00085-19. Print 2019 Jun. Infect Immun. 2019. PMID: 30936157 Free PMC article.
-
Treatment options for vancomycin-resistant enterococcal infections.Drugs. 2002;62(3):425-41. doi: 10.2165/00003495-200262030-00002. Drugs. 2002. PMID: 11827558 Review.
-
Bacteriophage Therapy as a Promising Alternative for Antibiotic-Resistant Enterococcus faecium: Advances and Challenges.Antibiotics (Basel). 2024 Nov 23;13(12):1120. doi: 10.3390/antibiotics13121120. Antibiotics (Basel). 2024. PMID: 39766510 Free PMC article. Review.
Cited by
-
Current Clinical Laboratory Challenges to Widespread Adoption of Phage Therapy in the United States.Antibiotics (Basel). 2025 May 29;14(6):553. doi: 10.3390/antibiotics14060553. Antibiotics (Basel). 2025. PMID: 40558145 Free PMC article. Review.
-
Characterization and purification of Pseudomonas aeruginosa phages for the treatment of canine infections.BMC Microbiol. 2025 May 14;25(1):289. doi: 10.1186/s12866-025-04005-4. BMC Microbiol. 2025. PMID: 40369432 Free PMC article.
References
-
- 2019. CDC: antibiotic resistance threats in the United States. Centers for Disease Control and Prevention, Atlanta, GA.
-
- Bereket W, Hemalatha K, Getenet B, Wondwossen T, Solomon A, Zeynudin A, Kannan S. 2012. Update on bacterial nosocomial infections. Eur Rev Med Pharmacol Sci 16:1039–1044. - PubMed
MeSH terms
Substances
LinkOut - more resources
Full Text Sources
Medical
