. 2024 Dec;12(12):e70107.
doi: 10.1002/iid3.70107.

Neohesperidin Dihydrochalcone Alleviates Lipopolysaccharide-Induced Vascular Endothelium Dysfunction by Regulating Antioxidant Capacity

Affiliations

Neohesperidin Dihydrochalcone Alleviates Lipopolysaccharide-Induced Vascular Endothelium Dysfunction by Regulating Antioxidant Capacity

Yuxin Nong et al. Immun Inflamm Dis. 2024 Dec.

Abstract

Background: Endothelial dysfunction is one of the important mechanisms of organ and tissue damage in sepsis. In this study, we evaluated the effects of neohesperidin dihydrochalone (NHDC) on lipopolysaccharide (LPS)-induced vascular dysfunction and explored the potential mechanisms.

Methods: In vivo, we assessed vascular leakage in mice by injecting Evans blue dye. In vitro, cell counting kit-8 (CCK-8) assay and flow cytometry were used to assess the activity of HUVEC and apoptosis. The effect of LPS on HUVEC barrier was assessed using FITC-extend membrane assay. The adhesion ability of HUVEC was tested by THP-1 cell adhesion assay. The antioxidant capacity of cells was measured by detecting the level of mitochondrial membrane potential, ROS, and content of CAT, SOD, GSH, and MDA within the cells. Furthermore, the release of endothelial IL-1β, IL-6, and TNF-α were detected by ELISA, and the expression level of TAK1, ERK1/2, and NFκB were detected by western blot.

Results: Treatment with NHDC effectively alleviated LPS-induced endothelial permeability and organ damage by reducing reactive oxygen species production and enhancing the antioxidant response. Further investigation suggested that NHDC may exert its protective effects by inhibiting the release of IL-1β, IL-6, and TNF-α, and by decreasing the phosphorylation of key inflammatory signaling molecules, including transforming growth factor-β-activated kinase 1 (TAK1), extracellular signal-regulated kinases 1/2 (ERK1/2), and nuclear factor kappa B (NFκB).

Conclusions: Our study indicate that pretreatment with NHDC may provide protection against LPS-induced vascular dysfunction by reducing oxidative stress and activation of inflammatory signaling pathways.

Keywords: endothelial dysfunction; inflammation; neohesperidin dihydrochalcone; oxidative stress; sepsis.


Conflict of interest statement

The authors declare no conflicts of interest.

Figures
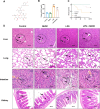
Figure 1
Figure 1
Effect of NHDC on LPS‐induced organ damage and survival in mice. (A) Schematici llustration of the chemical molecular structure of NHDC. (B) Protein concentration in the broncho‐alveolar lavage fluid (n = 5). (C) Kaplan–Meier survival curves for mice after LPS intraperitoneal injection (n = 10). (D) Representative histopathological sections stained with hematoxylin and eosin. The black arrows indicate the tissues with pathological changes after treatment in different groups (n = 4). The arrow indicates the dotted circle, which marks the classic representative area of the tissue. In the liver, * denotes the hepatic cords and sinusoids, while ▲ marks the central vein. In the lungs, * represents the alveolar structures and walls. In the kidney, the dotted circle highlights the glomerulus, and * indicates the tubular epithelial cells. In the intestine, * refers to the villi structure. Scale bar = 500 μm; *p < 0.05, **p < 0.01, ***p < 0.001, # p < 0.05, ### p < 0.001; *Compared with control group, #compared with LPS group.
Figure 2
Figure 2
NHDC alleviates LPS‐induced vascular leakage in mice. (A) Schematic diagram of the experimental procedure. (B) Representative pictures of skin color of different groups after injection of Evans blue. (C) Representative pictures of organs of mice after injection of Evans blue solution. (D) Leakage and statistics of analysis of different mouse organs after injection of Evans blue solution (n = 4). **p < 0.01, ***p < 0.001, # p < 0.05, ## p < 0.01; *Compared with control group, #compared with LPS group.
Figure 3
Figure 3
Effect of NHDC on HUVEC cell viability. (A) Effects of different LPS concentrations on HUVEC activity (n = 5). (B) Effects of different NHDC concentrations on HUVEC activity (n = 5). (C) Effect of NHDC on LPS‐induced HUVEC cell viability. (D, E) Flow cytometry results and statistical analysis of apoptotic staining with Annexin V‐FITC/PI in different groups (n = 4). **p < 0.01, ***p < 0.001, # p < 0.05, ## p < 0.01; *Compared with control group, #compared with LPS group.
Figure 4
Figure 4
Effects of NHDC on permeability and adhesion of endothelial cells in vitro. (A, B) Schematic diagram and statistical analysis of HUVEC penetration test in vitro (n = 4). (C) Fluorescence microscopy of THP1 cells (labeled with 5 uM Calcein AM) incubated with HUVEC cells for 2 h. (D) Quantification of THP1 adhesion to HUVEC cells (n = 4). (E) Immunofluorescence staining of ICAM‐1 in different groups. (F) Immunofluorescence intensity analysis of ICAM‐1 (n = 3). Scale bar: 500 μm; **p < 0.01, ***p < 0.001, # p < 0.05, ## p < 0.01, ### p < 0.001; *Compared with control group, #compared with LPS group.
Figure 5
Figure 5
Effects of NHDC on total antioxidant capacity of HUVEC cells exposed to LPS. (A) Reactive oxygen species levels in HUVEC cells after different treatments assessed using DCFH‐DA. (B) Statistical analysis of ROS level (n = 5). (C–F) CAT, SOD, GSH, and MDA activities of HUVEC in different groups (n = 4). (G) Fluorescence imaging of MMP levels in different groups of cells after JC‐1 staining. (H) Statistical analysis of mitochondrial membrane potential levels (n = 5). Scale bar: 500 μm; **p < 0.01, ***p < 0.001, # p < 0.05, ### p < 0.001; *Compared with control group, #compared with LPS group.
Figure 6
Figure 6
Effects of NHDC on inflammation regulation of HUVEC cells exposed to LPS. (A–C) The levels of IL‐1β, IL6, and TNF‐α released by HUVEC cells in the supernatant, assessed using ELISA (n = 4). (D) Western blot of TAK1, ERK1/2 phosphorylation levels, and NFκB expression. (E–G) Statistical analysis of western blot (n = 3). **p < 0.01, ***p < 0.001, # p < 0.05, ## p < 0.01; *Compared with control group, #compared with LPS group.
Figure 7
Figure 7
Effect of NFκB inhibition on LPS‐induced HUVEC damage. (A, B) Western blot and statistical analysis of NFκB phosphorylation levels after HUVEC‐treated with the inhibitor BAY11‐7082 (1 μM) for 24 h (n = 3). (C) CCK8 assay was used to detect HUVEC cell viability in different groups (n = 5). (D, E) flow cytometry and statistical analysis of apoptosis results in different groups of cells (n = 4). (F) Fluorescence representative map of ROS level in different groups of HUVEC detected by DCFH‐DA probe. (G) Statistical analysis of ROS levels (n = 4). (H–K) Activity levels of CAT, SOD, GSH, and MDA in different groups of HUVEC (n = 4). (L) Fluorescence representative plots of different groups of THP‐1 (labeled with 5 μM Calcein AM) adherent to HUVEC. (M) Quantitative statistics of THP‐1 adhesion (n = 4). Scale bar: 500 μm; *p < 0.05, ***p < 0.001, # p < 0.05, ## p < 0.01, ### p < 0.001; *Compared with control group, #compared with LPS group.

Similar articles

Cited by

References

    1. Lelubre C. and Vincent J. L., “Mechanisms and Treatment of Organ Failure in Sepsis,” Nature Reviews Nephrology 14, no. 7 (2018): 417–427. - PubMed
    1. Taghavi S., Abdullah S., Shaheen F., et al., “Exosomes and Microvesicles From Adipose‐Derived Mesenchymal Stem Cells Protects the Endothelial Glycocalyx From Lps Injury,” Shock 60, no. 1 (2023): 56–63. - PubMed
    1. Khakpour S., Wilhelmsen K., and Hellman J., “Vascular Endothelial Cell Toll‐Like Receptor Pathways in Sepsis,” Innate Immunity 21, no. 8 (2015): 827–846. - PubMed
    1. Frydman A., Weisshaus O., Huhman D. V., et al., “Metabolic Engineering of Plant Cells for Biotransformation of Hesperedin Into Neohesperidin, a Substrate for Production of the Low‐Calorie Sweetener and Flavor Enhancer NHDC,” Journal of Agricultural and Food Chemistry 53, no. 25 (2005): 9708–9712. - PubMed
    1. Younes M., Aquilina G., Castle L., et al., “Re‐Evaluation of Neohesperidine Dihydrochalcone (E 959) as a Food Additive,” EFSA Journal 17, no. 20 (2022): e07595. - PMC - PubMed

Publication types

MeSH terms