. 2025 Apr 1;23(4):339-349.
doi: 10.1158/1541-7786.MCR-24-0337.

Lysosomal-Mitochondrial Interaction Promotes Tumor Growth in Squamous Cell Carcinoma of the Head and Neck

Affiliations

Lysosomal-Mitochondrial Interaction Promotes Tumor Growth in Squamous Cell Carcinoma of the Head and Neck

Avani Gopalkrishnan et al. Mol Cancer Res. .

Abstract

Communication between intracellular organelles including lysosomes and mitochondria has recently been shown to regulate cellular proliferation and fitness. The way lysosomes and mitochondria communicate with each other [lysosomal-mitochondrial interaction (LMI)] is emerging as a major determinant of tumor proliferation and growth. About 30% of squamous carcinomas [including squamous cell carcinoma of the head and neck (SCCHN)] overexpress transmembrane member 16A (TMEM16A), a calcium-activated chloride channel, which promotes cellular growth and negatively correlates with patient survival. We have recently shown that TMEM16A drives lysosomal biogenesis; however, its impact on mitochondrial function has not been explored. In this study, we show that in the context of high-TMEM16A SCCHN, (i) patients display increased mitochondrial content, specifically complex I; (ii) in vitro and in vivo models uniquely depend on mitochondrial complex I activity for growth and survival; (iii) NRF2 signaling is a critical linchpin that drives mitochondrial function, and (iv) mitochondrial complex I and lysosomal function are codependent for proliferation. Taken together, our data demonstrate that coordinated lysosomal and mitochondrial activity and biogenesis via LMI drive tumor proliferation and facilitate a functional interaction between lysosomal and mitochondrial networks. Therefore, inhibition of LMI instauration may serve as a therapeutic strategy for patients with SCCHN. Implications: Intervention of LMI may serve as a therapeutic approach for patients with high TMEM16A-expressing SCCHN.


Conflict of interest statement

Competing Interest

The authors declare no conflict of interest.

Figures

Figure 1
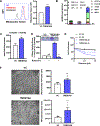
Figure 1. TMEM16A overexpressing SCCHN exhibit coordinated regulation of lysosomal biogenesis and mitochondrial complex I.
ERC analysis reveals several genes coding for lysosomal proteins and mitochondrial complex I proteins that co-evolve and are coregulated in squamous cell carcinoma of the head and neck cell lines (A). The expression of several mitochondrial and lysosomal genes and TMEM16A expression is co-regulated in a larger cohort of human SCCHN tumors (N=24). Correlation coefficients (p < 0.05) of regression analyses of various pairs of genes are shown in (B). Immunoblots of human tumor tissue show that these proteins are co-expressed in tumors that display overexpression of TMEM16A (C). Immunofluorescence analyses in OSC19 cells demonstrates co-localization of lysosomes with mitochondria in the context of TMEM16A overexpression (VC=Vector Control). The significance shown is calculated using an unpaired t test (D).
Figure 2:
Figure 2:. TMEM16A promotes upregulation of mitochondrial mass and biogenesis
OSC19 cells were engineered to stably overexpress TMEM16A. These cells were subjected to flow cytometry with Mitotracker dye to measure mitochondrial mass. TMEM16A overexpression increased Mitotracker staining. VC is vector control. (A). Gene expression analyses revealed a profound overexpression of genes associated with mitochondrial biogenesis in these cells (B). Consistent with prior data, the activity of mitochondrial complex I was increased upon TMEM16A overexpression (C). Cells were treated with diluent or rotenone and assessed for cell viability using colony formation assays (D). Similarly, VC or TMEM16A overexpressing cells were treated with diluent or rotenone for 2–4h and assessed for cell viability using WST assays (E). Tumor xenografts were generated by inoculating nude mice with the respective cells. Tumors were harvested and subjected to EM analyses to measure mitochondrial perimeter and area (F) For all panels, significance is calculated using an unpaired t test.
Figure 3:
Figure 3:. NRF2 activation in TMEM16A is pivotal in regulating mitochondrial function
Western blot shows short-interfering RNA (siRNA) targeted at NRF2 knocks down NRF2 protein (A). The effect of siNRF2 on ATP production was measured using ATPlite assay (B) mitochondrial mass (C) mitochondrial complex (D) and antioxidants transcript (E). For (D) and (E), bars are compared to fold change of VC + siControl. The putative model for TMEM16A induced mitochondrial function (F). For (B) and (C), statistics is done using one-way ANOVA with Tukey’s multiple comparisons test. For (D) and (E), unpaired t test is used.
Figure 4:
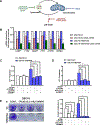
Figure 4:. Interaction between lysosomes and mitochondrial complex I regulate cancer cell viability
A proposed model for the interaction is shown in (A). Treatment with the complex I inhibitor, IACS-10759 reduces lysosomal biogenesis (B). Knock-down of lysosomal and ERC genes leads to a reduction in ATP production (C, D) and cell proliferation, as measured by colony formation (E). For (B), statistics is calculated using unpaired t test, for (C-E), one-way ANOVA with Tukey’s multiple comparisons test is used.
Figure 5:
Figure 5:. Complex I inhibition sensitizes TMEM16A-driven tumor xenograft models
Control and TMEM16A overexpressing OSC19 cells were evaluated for sensitivity to the complex I inhibitor, IACS-10759 (A). The effect of IACS-10759 on ATP production and TMRE fluorescence is shown in (B, C). The effect of IACS-10759 on subcutaneous tumors generated from the syngeneic murine SCCHN cell line (MOC1) is shown in (D). A patient-derived xenograft (PDX) was treated with IACS-10759 to demonstrate the anti-tumor activity (E). Representative tumor pictures and tumor weights after necropsy are shown in (F, G). For (B) and (C), one-way ANOVA with Tukey’s multiple comparison test is used, for (D) and (E), two-way ANOVA with Tukey’s multiple comparison test is used, unpaired t test is used for (G).

Update of

References

    1. Machado ER, Annunziata I, van de Vlekkert D, Grosveld GC, d’Azzo A, Lysosomes and Cancer Progression: A Malignant Liaison. Front Cell Dev Biol 9, 642494 (2021). - PMC - PubMed
    1. Taghizadeh-Hesary F, Akbari H, Bahadori M, Behnam B, Targeted Anti-Mitochondrial Therapy: The Future of Oncology. Genes (Basel) 13 (2022). - PMC - PubMed
    1. Porporato PE, Filigheddu N, Pedro JMB, Kroemer G, Galluzzi L, Mitochondrial metabolism and cancer. Cell Res 28, 265–280 (2018). - PMC - PubMed
    1. Hraběta J et al. , Drug Sequestration in Lysosomes as One of the Mechanisms of Chemoresistance of Cancer Cells and the Possibilities of Its Inhibition. International Journal of Molecular Sciences 21, 4392 (2020). - PMC - PubMed
    1. Herst PM, Carson GM, Eccles DA, Berridge MV, Bioenergetic and Metabolic Adaptation in Tumor Progression and Metastasis. Front Oncol 12, 857686 (2022). - PMC - PubMed

MeSH terms