. 2024 Dec 13:57:e14220.
doi: 10.1590/1414-431X2024e14220. eCollection 2024.

Comprehensive analysis of PDE2A: a novel biomarker for prognostic value and immunotherapeutic potential in human cancers

Affiliations

Comprehensive analysis of PDE2A: a novel biomarker for prognostic value and immunotherapeutic potential in human cancers

Zhen Yu et al. Braz J Med Biol Res. .

Abstract

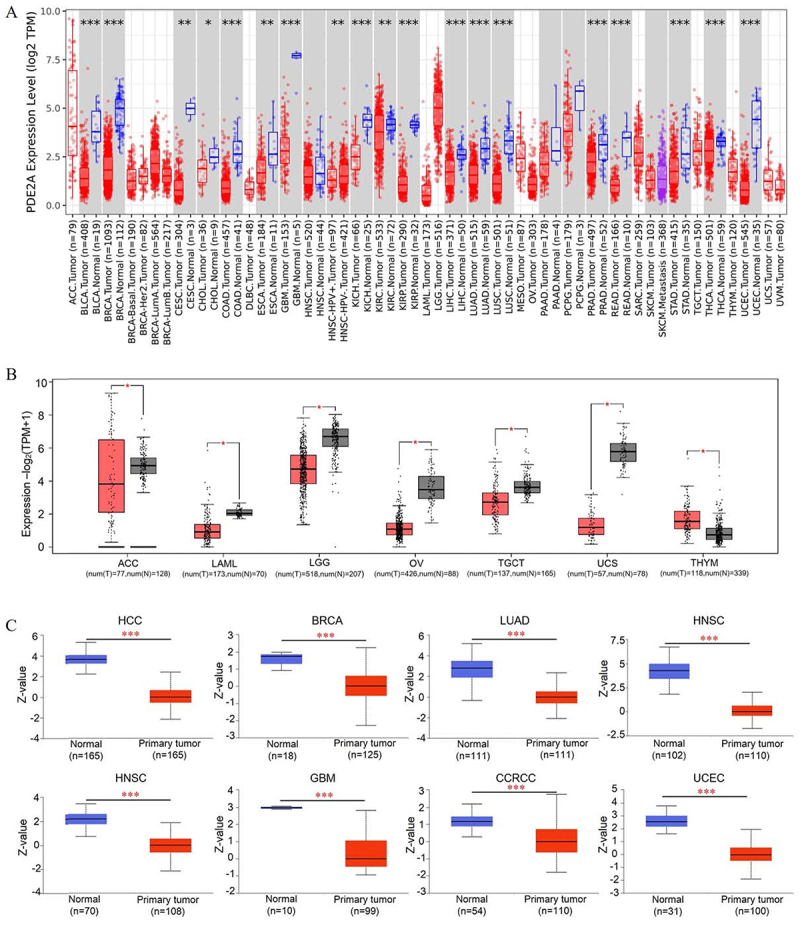
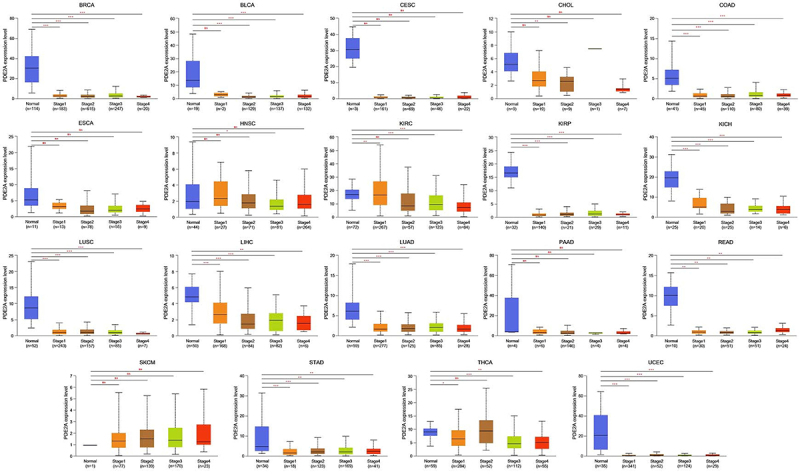
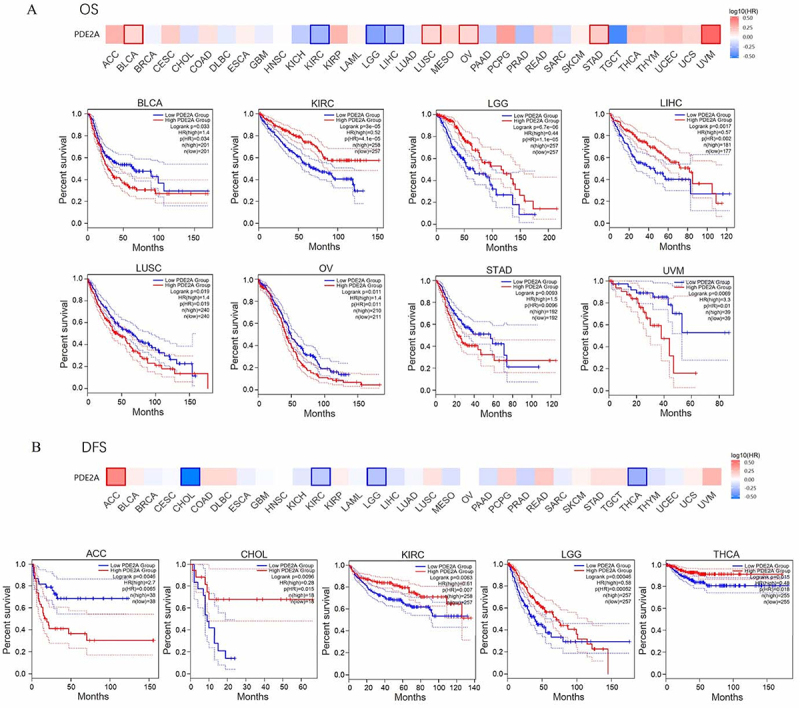
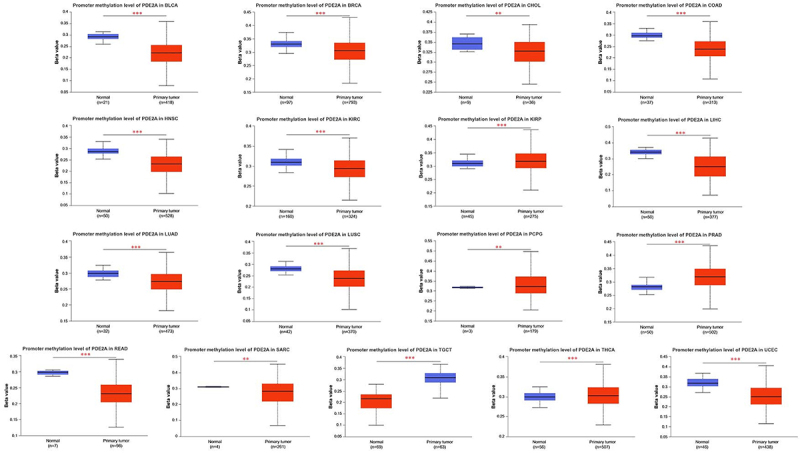
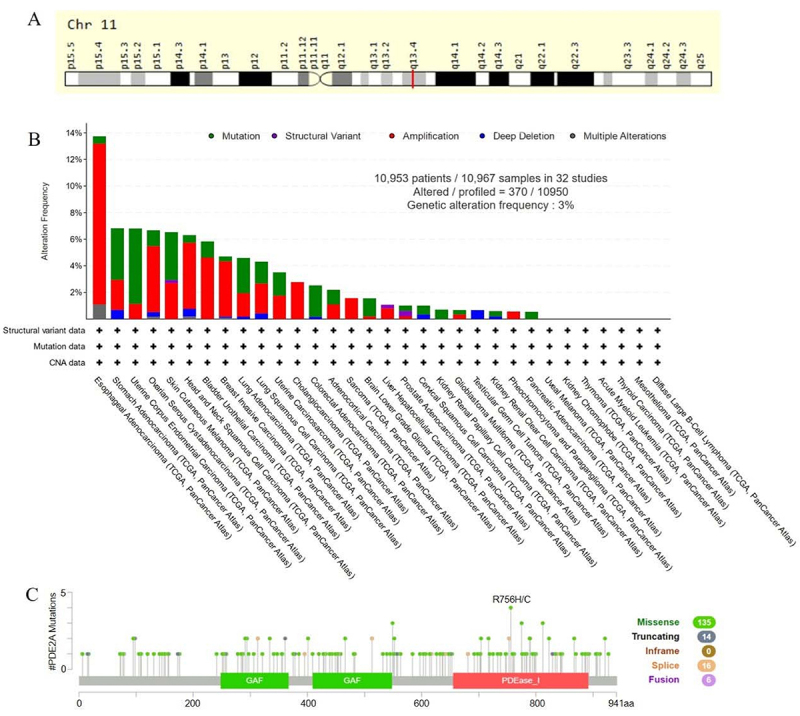
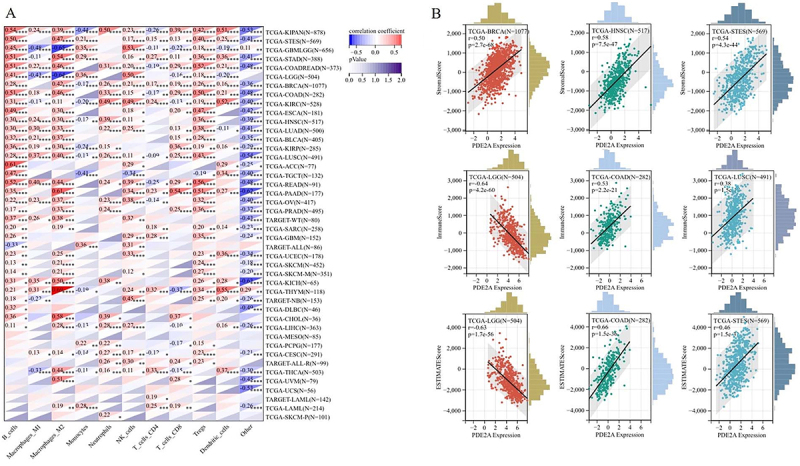
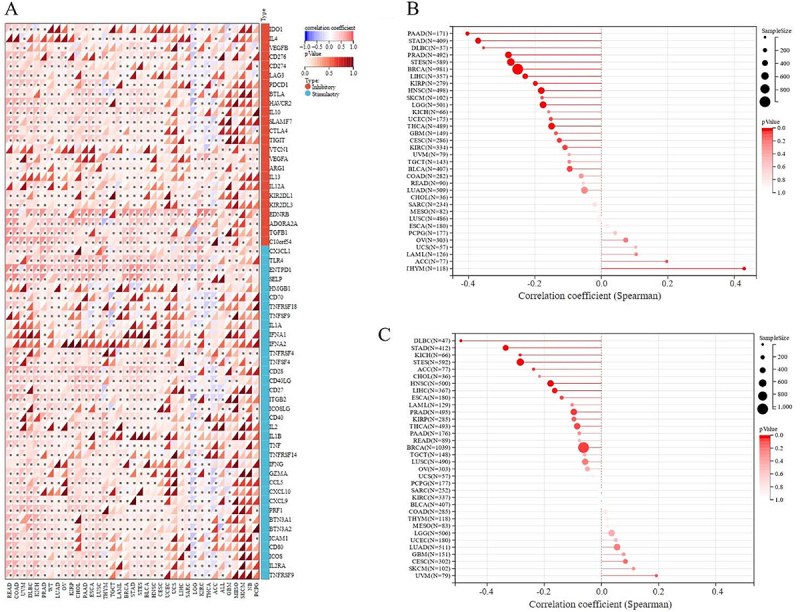
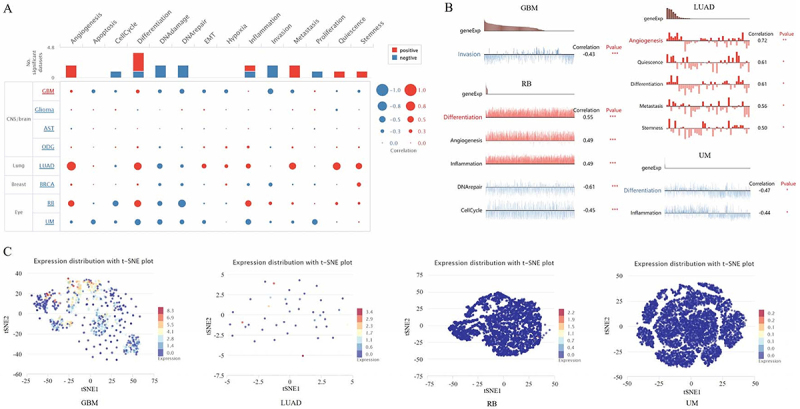
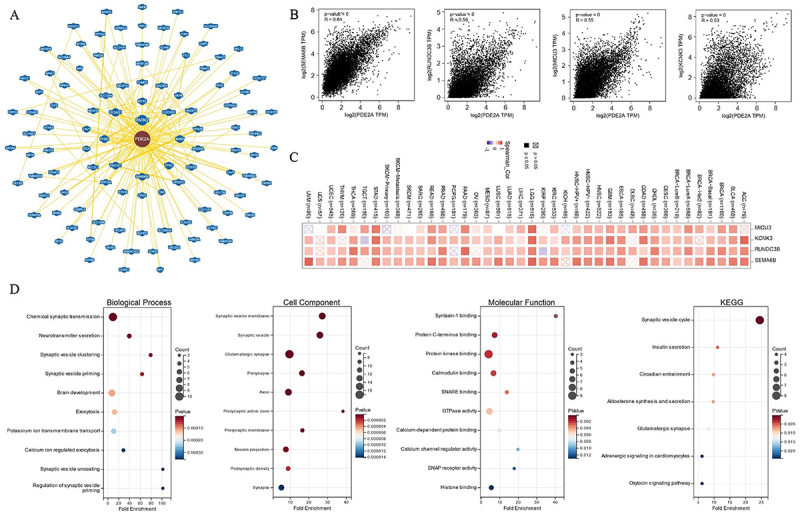
Phosphodiesterase 2A (PDE2A) plays a pivotal role in modulating cyclic nucleotide metabolism. Recent studies have shown that PDE2A is associated with some tumors, but its expression profiles, prognostic significance, and immunological roles in diverse cancer types remain unclear. Utilizing advanced bioinformatics tools, we performed a comprehensive analysis of PDE2A gene expression in multiple human cancers. Our study revealed that PDE2A expression was significantly reduced in the majority of cancer types and clinicopathological stages (I to IV) compared to normal tissues. Additionally, PDE2A expression was closely related to the prognosis of cancers such as stomach adenocarcinoma (STAD), ovarian serous cystadenocarcinoma (OV), and liver hepatocellular carcinoma (LIHC). Cox regression analyses indicated that PDE2A can act as an independent prognostic factor for these cancers. The level of PDE2A DNA methylation was significantly decreased in most cancers. Genetic alterations in PDE2A predominantly manifest in the form of amplifications. Moreover, infiltrating cells and immune checkpoint genes, including PDCD1, exhibited notable correlations with PDE2A expression. Significant associations were observed between PDE2A expression and tumor mutation burden as well as microsatellite instability. Single cell sequencing revealed PDE2A's crucial role in regulating differentiation and angiogenesis of cancer cells. Functional enrichment analysis emphasized the important role of PDE2A in synaptic transmission and tumor development. Aberrant expression of PDE2A influenced the sensitivity of various antitumor and chemotherapy drugs. This research provided a comprehensive analysis of PDE2A in human cancers, highlighting its potential as both a prognostic marker and an immunotherapy target for future research.


Figures

Figure 1
Figure 1. Study workflow. ICP: immune checkpoint; TMB: tumor mutation burden; MSI: microsatellite instability.
Figure 2
Figure 2. The expression status of PDE2A in pan-cancer. A, Differential expression levels of PDE2A between tumor samples and paired normal tissues across various cancers in the TCGA database (*P<0.05, **P<0.01, ***P<0.001). B, Comparative analysis of PDE2A expression differences among ACC, LAML, LGG, OV, TGCT, UCS, and THYM using data from Genotype-Tissue Expression and The Cancer Genome Atlas (*P<0.05). C, Assessment of PDE2A protein expression levels in primary tissues vs normal tissues for HCC, BRCA, LUAD, LUSC, HNSC, GBM, CCRCC, and UCEC based on the CPTAC dataset (***P<0.001). Lines in boxes represent median and interquartile range (Wilcoxon rank-sum test).
Figure 3
Figure 3. Correlation between PDE2A gene expression and different pathological stages of BRCA, BLCA, CESC, CHOL, COAD, ESCA, HNSC, KIRC, KIRP, KICH, LUSC, LIHC, LUAD, PAAD, READ, SKCM, STAD, THCA, and UCEC based on The Cancer Genome Atlas dataset (*P<0.05, **P<0.01, ***P<0.001, ns: no significance). Lines in boxes represent median and interquartile range (Student'st-test).
Figure 4
Figure 4. Prognostic values of PDE2A gene expression in pan-cancerous tumors. A, Correlation of overall survival (OS) with PDE2A gene expression in BLCA, KIRC, LGG, LIHC, LUSC, OV, STAD, and UVM. B, Correlation of disease-free survival (DFS) with PDE2A gene expression in ACC, CHOL, KIRC, LGG, and THCA.
Figure 5
Figure 5. Promoter methylation levels of PDE2A in various cancer types. The UALCAN tool was employed to analyze and compare the methylation values of PDE2A between normal and primary tumor tissues. *P<0.05, **P<0.01, ***P<0.001. Lines in boxes represent median and interquartile range (Student'st-test).
Figure 6
Figure 6. Genomic information and genetic alteration characteristics of PDE2A. A, Genomic location of PDE2A gene. B, Mutation types and frequencies of PDE2A. C, Mutation sites of PDE2A protein domains in pan-cancer.
Figure 7
Figure 7. The association between the expression of PDE2A and immune cell infiltration. A, Correlation of PDE2A expression with immune infiltration across 44 cancers in TCGA data. *P<0.05, **P<0.01, ***P<0.001, ****P<0.0001 (Spearman's correlation). B, The top 3 most significantly correlated cancers with the association between PDE2A expression and Stromal score, Immune score, and ESTIMATE score.
Figure 8
Figure 8. PDE2A and immune checkpoint inhibitors (ICIs) immunotherapy.A, Correlation between PDE2A and various immune checkpoint (ICP) genes. B, Correlation between PDE2A expression and tumor mutation burden (TMB). C, Correlation between PDE2A expression and microsatellite instability (MSI). The Spearman's correlation test was used for statistical analyses.
Figure 9
Figure 9. Expression pattern of PDE2A at single-cell levels. A, Average correlations between PDE2A expression and functional states in different cancers. B, Functional relevance of PDE2A in GBM, LUAD, RB, and UM. *P<0.05, **P<0.01, ***P<0.001 (Student'st-test). C, T-distributed stochastic neighbor embedding (T-SNE) plots of PDE2A expression at single cells from GBM, LUAD, RB, and UM.
Figure 10
Figure 10. Enrichment analysis of PDE2A-related genes. A, PDE2A-related proteins from BioGRID database. B, Expression correlation between PDE2A and SEMA6B, RUNDC3B, MICU3, and KCNK3 genes. P<0.001. C, Heatmap of correlation between PDE2A expression and SEMA6B, RUNDC3B, MICU3, and KCNK3 genes. D, The GO/KEGG analysis is based on PDE2A-related genes (Student's t-test).

Similar articles

Cited by

References

    1. Siegel RL, Giaquinto AN, Jemal A. Cancer statistics, 2024. CA Cancer J Clin. 2024;74:12–49. doi: 10.3322/caac.21820. - DOI - PubMed
    1. Li Y, Dou Y, Leprevost FDV, Geffen Y, Calinawan AP, Aguet F, et al. Proteogenomic data and resources for pan-cancer analysis. Cancer Cell. 2023;41:1397–1406. doi: 10.1016/j.ccell.2023.06.009. - DOI - PMC - PubMed
    1. Martínez-Jiménez F, Movasati A, Brunner SR, Nguyen L, Priestley P, Cuppen E, et al. Pan-cancer whole-genome comparison of primary and metastatic solid tumours. Nature. 2023;618:333–341. doi: 10.1038/s41586-023-06054-z. - DOI - PMC - PubMed
    1. Nakashima K, Matsui H. A novel inhibition modality for phosphodiesterase 2A. SLAS Discov. 2020;25:498–505. doi: 10.1177/2472555220913241. - DOI - PubMed
    1. Jiang M, Yan W, Zhang Y, Lu Z, Lu T, Zhang D, et al. Phosphodiesterase and psychiatric disorders: a two-sample Mendelian randomization study. J Transl Med. 2023;21:560. doi: 10.1186/s12967-023-04368-0. - DOI - PMC - PubMed

Substances