. 2024 Dec 19;19(12):e0314961.
doi: 10.1371/journal.pone.0314961. eCollection 2024.

Exploring the mechanism of berberine treatment for atherosclerosis combined with non-alcoholic fatty liver disease based on bioinformatic and experimental study

Affiliations

Exploring the mechanism of berberine treatment for atherosclerosis combined with non-alcoholic fatty liver disease based on bioinformatic and experimental study

Shushu Wang et al. PLoS One. .

Abstract

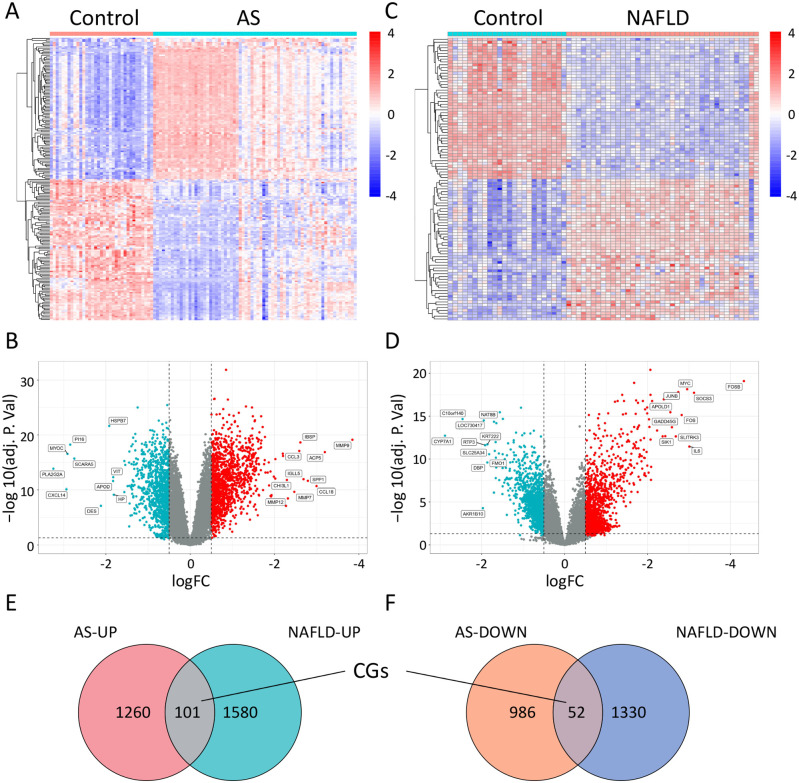
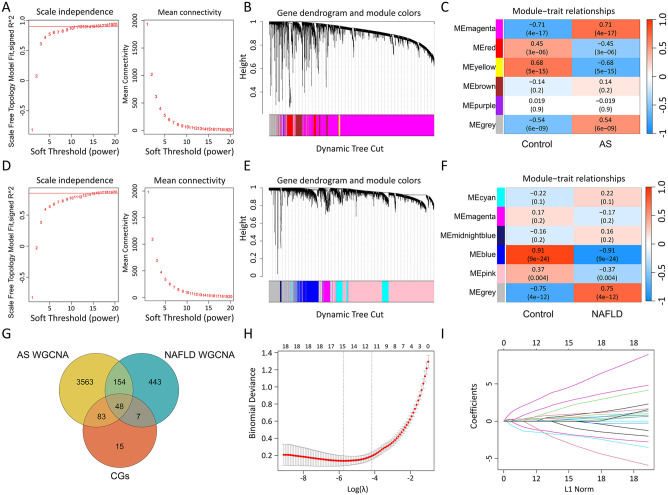
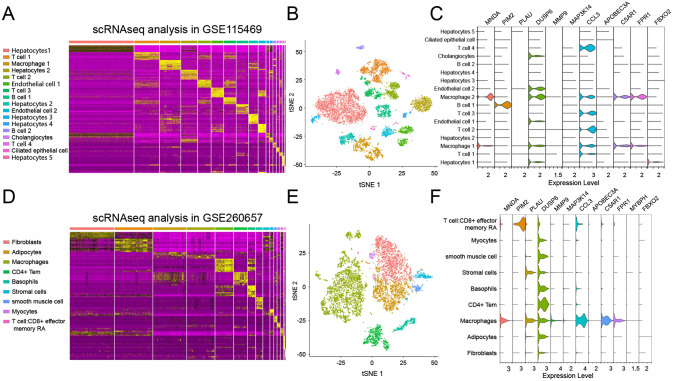
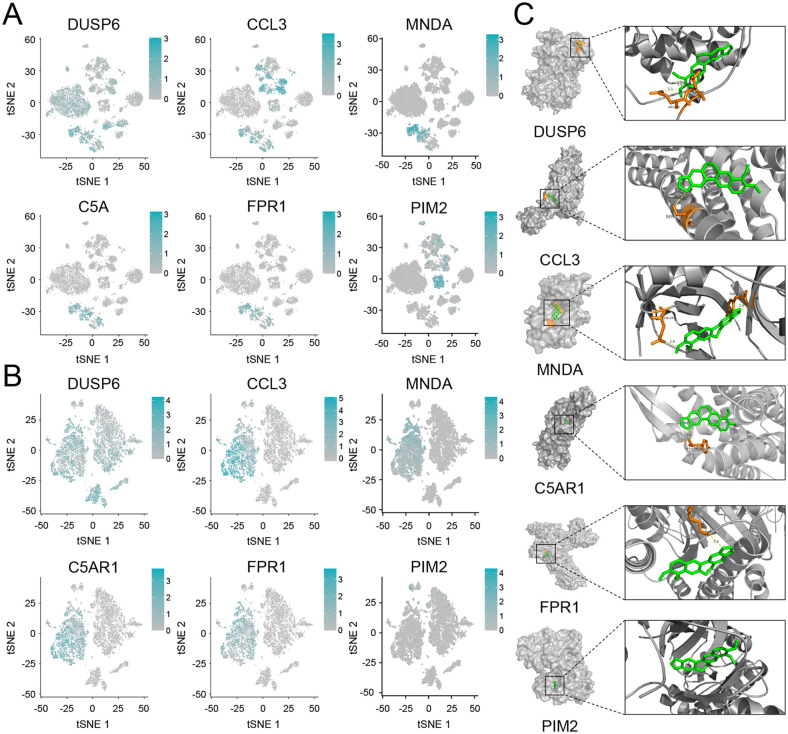
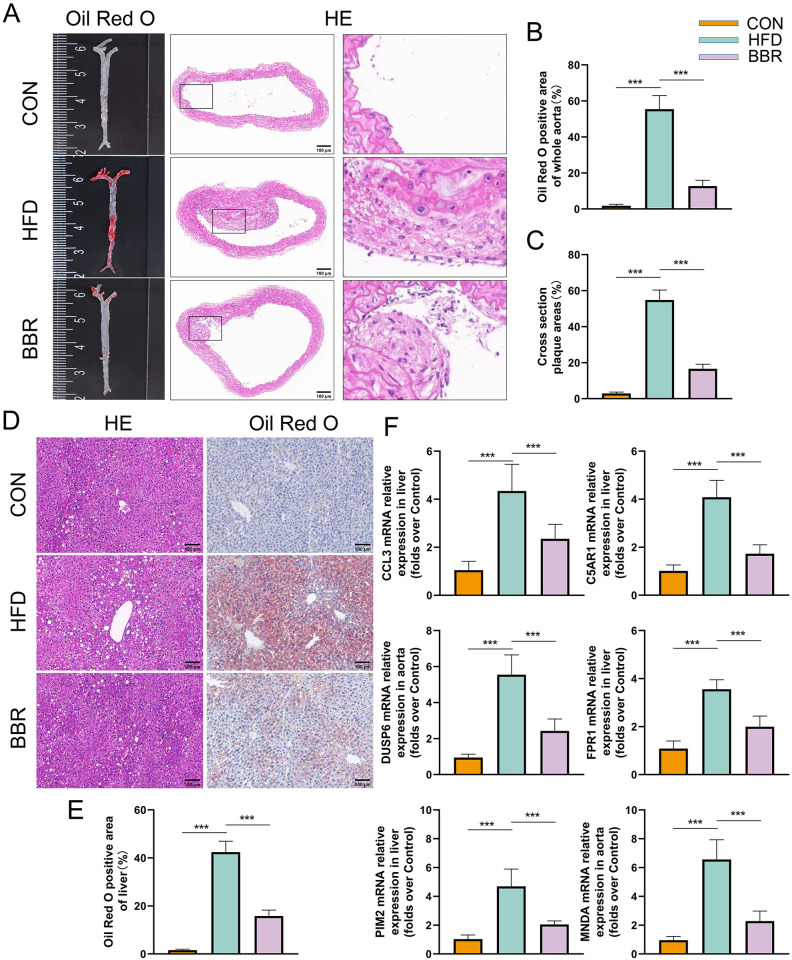
Atherosclerosis (AS) and Non-alcoholic fatty liver disease (NAFLD) are chronic metabolic disorders with high prevalence and significant health impacts. Both conditions share common pathophysiological pathways including abnormal lipid metabolism and inflammation. Berberine (BBR), an isoquinoline alkaloid, is known for its beneficial effects on various metabolic and cardiovascular disorders. This study investigates BBR's impact on AS and NAFLD through bioinformatics analysis and experimental models. This study utilized various bioinformatics methods, including transcriptome analysis, weighted gene co-expression network analysis (WGCNA), machine learning, and molecular docking, to identify key genes and pathways involved in AS and NAFLD. Subsequently an animal model of AS combined with NAFLD was established using ApoE-/- mice fed a high-fat diet. The efficacy and mechanism of action of BBR were verified using methods such as hematoxylin and eosin (HE) staining, Oil Red O staining, and real-time quantitative PCR (RTqPCR). Through transcriptome analysis, WGCNA, and machine learning, this study identified 48 key genes involved in both AS and NAFLD. Function analysis revealed that the implicated genes were significantly involved in pathways like cytokine-cytokine receptor interaction, chemokine signaling, and IL-17 signaling pathway, suggesting their role in inflammation and immune responses. Single cell validation identified six key genes: dual specificity phosphatase 6 (DUSP6), chemokine ligand 3 (CCL3), complement component 5a receptor 1 (C5AR1), formyl peptide receptor 1 (FPR1), myeloid nuclear differentiation antigen (MNDA), and proviral integration site of murine 2(PIM2). Finally, molecular docking and animal experiments showed that BBR significantly reduced lipid deposits and inflammatory markers in liver and aortic tissues. In conclusion, BBR can improve AS combined with NAFLD by regulating genes like MNDA, PIM2, DUSP6, CCL3, C5AR1, and FPR1, with the mechanism related to inflammation control. The findings suggest potential clinical benefits of BBR in reducing the progression of both AS and NAFLD, warranting further investigation.


Conflict of interest statement

The authors have declared that no competing interests exist.

Figures

Fig 1
Fig 1. Flowchart of the study design.
Fig 2
Fig 2. Bioinformatics of disease targets for AS and NAFLD.
A-B: Heatmaps and volcano plots analyzing the differential gene expression between AS patients and normal control groups. C-D: Heatmaps and volcano plots for the differential gene expression analysis between NAFLD patients and normal control groups. E-F: Venn diagrams showing the overlap of commonly upregulated and downregulated genes between AS and NAFLD conditions.
Fig 3
Fig 3. WGCNA and machine learning algorithms.
A: Scale-free topology fit index and average connectivity analysis for the GSE100927 dataset. B: Dendrogram of the GSE100927 dataset, where the upper part shows the hierarchical clustering of genes, and the lower part shows gene modules, also known as network modules. C: Heatmap of gene correlations with the AS phenotype in the GSE100927 dataset. The color blocks on the left represent modules, and the color bars on the right indicate the range of correlation; the darker the color in the heatmap, the higher the correlation, with red indicating positive correlation and blue indicating negative correlation. Each cell contains numbers representing correlation strength and significance. D: Scale-free topology fit index and average connectivity analysis for the GSE89632 dataset. E: Dendrogram of the GSE89632 dataset, displaying clustering of genes into modules. F: Heatmap of gene correlations with the NAFLD phenotype in the GSE89632 dataset. G: Venn diagram of the intersection of key module genes from AS and NAFLD with CGs, yielding 48 Key Genes. H-I: Lasso regression analysis on the 48 Key Genes to compute diagnostic biomarkers’ lambda (λ) value (H) and its minimum value (I).
Fig 4
Fig 4. Single-cell sequencing validation lasso genes in liver and atherosclerotic aortic tissues.
A: Heatmap of highly variable genes in the liver tissue single-cell dataset GSE115469, used for clustering cells. B: t-SNE cell clustering in the GSE115469 dataset. C: Violin plots showing the expression levels of Lasso genes across different liver tissue cell clusters. D: Heatmap of highly variable genes in the aortic tissue single-cell dataset GSE260657. E: t-SNE cell clustering in the GSE260657 dataset. F: Violin plots showing the expression levels of Lasso genes across different aortic tissue cell clusters.
Fig 5
Fig 5. Distribution of 6 core genes in liver and aortic tissues and their molecular docking with BBR.
A: The distribution of the 6 core genes in liver tissue. B: The distribution of the 6 core genes in aortic tissue. C: Results of the molecular docking of the 6 core genes with BBR.
Fig 6
Fig 6. Vivo experiment validating BBR’s therapeutic effects on AS combined with NAFLD.
A: Representative images of whole aorta Oil Red O staining and aortic cross-section HE staining for each group of mice (scale bar: 100 μm). B-C: Statistical graphs of whole aorta Oil Red O and HE staining for each group (n = 3). D: Representative images of liver HE staining and Oil Red O staining for various groups of mice (scale bar: 100 μm). E: Statistical graph of liver Oil Red O staining results for each group (n = 3). F: mRNA expression levels of the 6 core genes in liver tissue (n = 5).

Similar articles

Cited by

References

    1. Zhao D, Liu J, Wang M, Zhang X, Zhou M. Epidemiology of cardiovascular disease in China: current features and implications. Nat Rev Cardiol. 2019;16(4):203–12. doi: 10.1038/s41569-018-0119-4 . - DOI - PubMed
    1. Powell EE, Wong VW, Rinella M. Non-alcoholic fatty liver disease. Lancet. 2021;397(10290):2212–24. Epub 20210421. doi: 10.1016/S0140-6736(20)32511-3 . - DOI - PubMed
    1. Lonardo A, Sookoian S, Pirola CJ, Targher G. Non-alcoholic fatty liver disease and risk of cardiovascular disease. Metabolism. 2016;65(8):1136–50. Epub 20150925. doi: 10.1016/j.metabol.2015.09.017 . - DOI - PubMed
    1. Ampuero J, Gallego-Duran R, Romero-Gomez M. Association of NAFLD with subclinical atherosclerosis and coronary-artery disease: meta-analysis. Rev Esp Enferm Dig. 2015;107(1):10–6. . - PubMed
    1. Madan SA, John F, Pyrsopoulos N, Pitchumoni CS. Nonalcoholic fatty liver disease and carotid artery atherosclerosis in children and adults: a meta-analysis. Eur J Gastroenterol Hepatol. 2015;27(11):1237–48. doi: 10.1097/MEG.0000000000000429 . - DOI - PubMed