. 2024 Dec 24;121(52):e2407225121.
doi: 10.1073/pnas.2407225121. Epub 2024 Dec 19.

Growth hormone receptor in VGLUT2 or Sim1 cells regulates glycemia and insulin sensitivity

Affiliations

Growth hormone receptor in VGLUT2 or Sim1 cells regulates glycemia and insulin sensitivity

Mariana R Tavares et al. Proc Natl Acad Sci U S A. .

Abstract

Growth hormone (GH) has several metabolic effects, including a profound impact on glucose homeostasis. For example, GH oversecretion induces insulin resistance and increases the risk of developing diabetes mellitus. Here, we show that GH receptor (GHR) ablation in vesicular glutamate transporter 2 (VGLUT2)-expressing cells, which comprise a subgroup of glutamatergic neurons, led to a slight decrease in lean body mass without inducing changes in body adiposity. VGLUT2∆GHR mice exhibited reduced glycemia and improved glucose tolerance and insulin sensitivity. Among different glutamatergic neuronal populations, we found that GHR inactivation in Sim1-expressing cells recapitulated the phenotype observed in VGLUT2∆GHR mice. Furthermore, Sim1∆GHR mice exhibited reduced endogenous glucose production and improved hepatic insulin sensitivity without alterations in whole-body or muscle glucose uptake. Sim1∆GHR mice were protected against acute but not chronic diabetogenic effects of exogenous GH administration. Pharmacological activation of ATP-sensitive potassium channels in the brain normalized blood glucose levels in Sim1∆GHR mice. In conclusion, the absence of GHR signaling in VGLUT2/Sim1-expressing cells causes a persistent reduction in glycemia and improves hepatic insulin sensitivity. Central glucose-sensing mechanisms are likely involved in the reduced glycemia exhibited by Sim1∆GHR mice. The current findings uncover a mechanism involved in the effects of GHR signaling in regulating glucose homeostasis.

Keywords: GH; diabetes mellitus; glucose metabolism; insulin.


Conflict of interest statement

Competing interests statement:The authors declare no competing interest.

Figures

Fig. 1.
Fig. 1.
GHR ablation in GABAergic and glutamatergic neuronal populations. (A and B) Colocalization between GH-induced pSTAT5 (magenta) and VGAT-expressing cells (green; GABAergic neurons) in different hypothalamic nuclei of control mice after an i.p. pGH injection. (C and D) Colocalization between pGH-induced pSTAT5 (magenta) and VGLUT2-expressing cells (green; glutamatergic neurons) in different hypothalamic nuclei of control mice after injecting pGH. (E and F) Absence of colocalizations between pSTAT5 and VGAT-expressing cells in VGAT∆GHR mice after a pGH injection. (G and H) Absence of colocalizations between pSTAT5 and VGLUT2-expressing cells in VGLUT2∆GHR mice after a pGH infusion. Abbreviations: 3 V, third ventricle; ARH, arcuate nucleus; PVH, paraventricular nucleus of the hypothalamus; VMH, ventromedial nucleus of the hypothalamus. (Scale bar, 100 μm.)
Fig. 2.
Fig. 2.
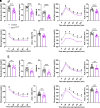
The absence of GH action in glutamatergic neurons reduces glycemia and improves insulin sensitivity. (AD) Body, lean, and fat mass in 20-wk-old control, VGAT∆GHR, and VGLUT2∆GHR male mice. (E) Basal glycemia in male mice. (FI) Glucose tolerance test (GTT) and insulin tolerance test (ITT) and the respective areas under the curve (AUC) in control, VGAT∆GHR, and VGLUT2∆GHR male mice. (JM) Body, lean, and fat mass in 20-wk-old control, VGAT∆GHR, and VGLUT2∆GHR female mice. (N) Basal glycemia in female mice. (OR) GTT and ITT and the respective AUC in control, VGAT∆GHR, and VGLUT2∆GHR female mice. *P < 0.05, **P < 0.01, ***P < 0.001, ****P < 0.0001. Complete statistical information and sample size of each figure are described in SI Appendix, Table S1. Data are expressed as mean ± SEM.
Fig. 3.
Fig. 3.
GHR ablation in Sim1-expressing cells leads to a mild reduction of lean body mass without changes in adiposity. (AC) Colocalization between pSTAT5 (magenta) and Sim1-expressing cells (green) in the paraventricular nucleus of the hypothalamus (PVH) of control mice after an i.p. pGH injection. (DF) Absence of colocalizations of pGH-induced pSTAT5 in Sim1-expressing cells of Sim1∆GHR mice. (G and H) pSTAT5 and Sim1-expressing cells in the amygdala of control and Sim1∆GHR mice after an i.p. pGH injection. Abbreviation: 3 V, third ventricle; CEA, central nucleus of the amygdala; opt, optic tract. (Scale bar, 200 μm.) (I) Ghr mRNA expression in the liver, skeletal muscle, white adipose tissue (WAT), and kidney. (JL) Changes in body, lean, and fat mass over time in control and Sim1∆GHR male mice. (MO) Changes in body, lean, and fat mass over time in control and Sim1∆GHR female mice. *P < 0.05, ***P < 0.001. Complete statistical information and sample size of each figure are described in SI Appendix, Table S1. Data are expressed as mean ± SEM.
Fig. 4.
Fig. 4.
Sim1∆GHR mice exhibit reduced glycemia and improved glucose tolerance and insulin sensitivity. (AC) Basal glycemia, serum insulin levels, and HOMA-IR index in control and Sim1∆GHR male mice. (DF) Glucose tolerance test (GTT), insulin tolerance test (ITT), and pyruvate tolerance test (PTT) and the respective areas under the curve (AUC) in control and Sim1∆GHR male mice. (GI) Basal glycemia, serum insulin levels, and HOMA-IR index in control and Sim1∆GHR female mice. (JL) GTT, ITT, PTT, and the respective AUC in control and Sim1∆GHR female mice. *P < 0.05, **P < 0.01, ***P < 0.001, ****P < 0.0001. Complete statistical information and sample size of each figure are described in SI Appendix, Table S1. Data are expressed as mean ± SEM.
Fig. 5.
Fig. 5.
Hyperinsulinemic-euglycemic clamp showing increased hepatic insulin sensitivity in Sim1∆GHR mice. (A) Changes in blood glucose levels and glucose infusion rate (GIR) during a hyperinsulinemic-euglycemic clamp in control and Sim1∆GHR male mice. (B) GIR during the clamp. (C) Whole-body glucose uptake in the basal state and during the clamp. (D and E) 2-deoxy-D-[1-14C]-glucose (2-DG) uptake in the skeletal muscle and white adipose tissue (WAT). (F) Endogenous glucose production (EGP) in the basal state and during the clamp. (G) Percentage of insulin-induced EGP suppression during the clamp. (H) Concentrations of nonesterified fatty acids (NEFA) in the basal state and during the clamp. (I) Percentage of NEFA suppression during the clamp. (J) Western blot showing pAKT, total AKT, and β-actin expression in the liver, gastrocnemius muscle, and white adipose tissue of control and Sim1∆GHR male mice killed 20 min after an injection of saline or insulin. Bar graphs show the quantification of pAKT normalized by total protein expression (Ponceau staining; SI Appendix, Fig. S11). *P < 0.05, **P < 0.01, ***P < 0.001, ****P < 0.0001. Complete statistical information and sample size of each figure are described in SI Appendix, Table S1. Data are expressed as mean ± SEM.
Fig. 6.
Fig. 6.
Central glucose-sensing mechanisms are involved in the reduced glycemia exhibited by Sim1∆GHR mice. (A) Basal glycemia 2 h after a single i.p. saline or pGH injection in control and Sim1∆GHR male mice. (B) Scheme illustrating the experimental design used to infuse pGH chronically. Created in BioRender. (C) Insulin tolerance test (ITT) and the area under the curve (AUC) in control and Sim1∆GHR male mice after 5 d of saline or pGH treatment. (D) Blood glucose levels and the AUC in control and Sim1∆GHR male mice after an icv injection of artificial cerebrospinal fluid (aCSF). (E) Blood glucose levels and the AUC in control and Sim1∆GHR male mice after an icv diazoxide injection. *P < 0.05, **P < 0.01, ***P < 0.001, ****P < 0.0001. Complete statistical information and sample size of each figure are described in SI Appendix, Table S1. Data are expressed as mean ± SEM.

References

    1. Houssay B. A., Anderson E., Diabetogenic action of purified anterior pituitary hormones. Endocrinology 45, 627–629 (1949). - PubMed
    1. Houssay B. A., Biasotti A., The hypophysis, carbohydrate metabolism and diabetes. Endocrinology 15, 511–523 (1931).
    1. Houssay B. A., Penhos J. C., Diabetogenic action of pituitary hormones on adrenalectomized hypophysectomized dogs. Endocrinology 59, 637–641 (1956). - PubMed
    1. Houssay B. A., Rodriguez R. R., Diabetogenic action of different preparations of growth hormone. Endocrinology 53, 114–116 (1953). - PubMed
    1. Zierler K. L., Rabinowitz D., Roles of insulin and growth hormone, based on studies of forearm metabolism in man. Medicine (Baltimore) 42, 385–402 (1963). - PubMed

MeSH terms

LinkOut - more resources