Evaluation of inflammation adjustment methods to assess iron deficiency using longitudinal data from norovirus human challenge trials
- PMID: 39700205
- PMCID: PMC11658468
- DOI: 10.1371/journal.pgph.0003964
Evaluation of inflammation adjustment methods to assess iron deficiency using longitudinal data from norovirus human challenge trials
Abstract
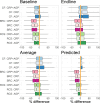
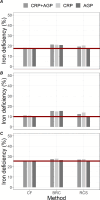
Accounting for inflammation is necessary to assess iron deficiency using ferritin. A limitation of existing inflammation-adjustment methods is reliance on cross-sectional data to evaluate method performance. The study objective was to evaluate three inflammation-adjustment methods using longitudinal data from two controlled trials where apparently healthy adults (n = 52) were exposed to norovirus. Correction factors (CF), the Biomarkers Reflecting Inflammation and Nutritional Determinants of Anemia (BRINDA) regression correction (BRC), and restricted cubic splines (RCS) were used to adjust the influence of inflammation on ferritin using alpha-1-acid glycoprotein (AGP) and/or C-reactive protein (CRP). Blood was collected at baseline (day 0, pre-exposure to norovirus) and at 9 time points post-exposure (days 1, 2, 3, 4, 7, 14, 21, 28, and 35). Inflammation-adjusted ferritin concentrations were compared with 1) baseline, 2) endline, 3) the average of baseline and endline, and 4) predicted ferritin concentrations among subjects with infection, expressed as percent difference. The predicted ferritin concentrations were modeled using data from 26 subjects without infection in a linear mixed model. Adjusting for CRP or AGP, the median differences between adjusted ferritin using CF, BRC, and RCS were respectively [0.2%, 2.5%], [-22.2%, -20.8%], [-16.7%, -7.1%] compared with the average of baseline and endline values and were 0%, [-16.8%, -18.5%], [-8.9%, -2.8%] compared with predicted ferritin concentrations. For BRC, adjusting for both CRP and AGP tended to result in more over-adjustment of ferritin compared to using a single inflammatory protein. The BRC appeared to overcorrect ferritin in this study setting, while the CF yielded adjusted ferritin concentrations closer to the average baseline and endline concentrations and the predicted concentrations. Longitudinal studies with larger sample sizes exposed to other infectious agents are needed to further evaluate inflammation-adjustment methods and the need for including multiple inflammation biomarkers.
Copyright: © 2024 Ko et al. This is an open access article distributed under the terms of the Creative Commons Attribution License, which permits unrestricted use, distribution, and reproduction in any medium, provided the original author and source are credited.
Conflict of interest statement
The authors have declared that no competing interests exist.
Figures


References
-
- Thurnham DI, McCabe LD, Haldar S, Wieringa FT, Northrop-Clewes CA, McCabe GP. Adjusting plasma ferritin concentrations to remove the effects of subclinical inflammation in the assessment of iron deficiency: a meta-analysis. Am J Clin Nutr. 2010;92(3):546–55. doi: 10.3945/ajcn.2010.29284 - DOI - PubMed
LinkOut - more resources
Full Text Sources
Research Materials
Miscellaneous
