. 2024 Dec 20;386(6728):1389-1395.
doi: 10.1126/science.adi2396. Epub 2024 Dec 19.

Coupling antigens from multiple subtypes of influenza can broaden antibody and T cell responses

Affiliations

Coupling antigens from multiple subtypes of influenza can broaden antibody and T cell responses

Vamsee Mallajosyula et al. Science. .

Abstract

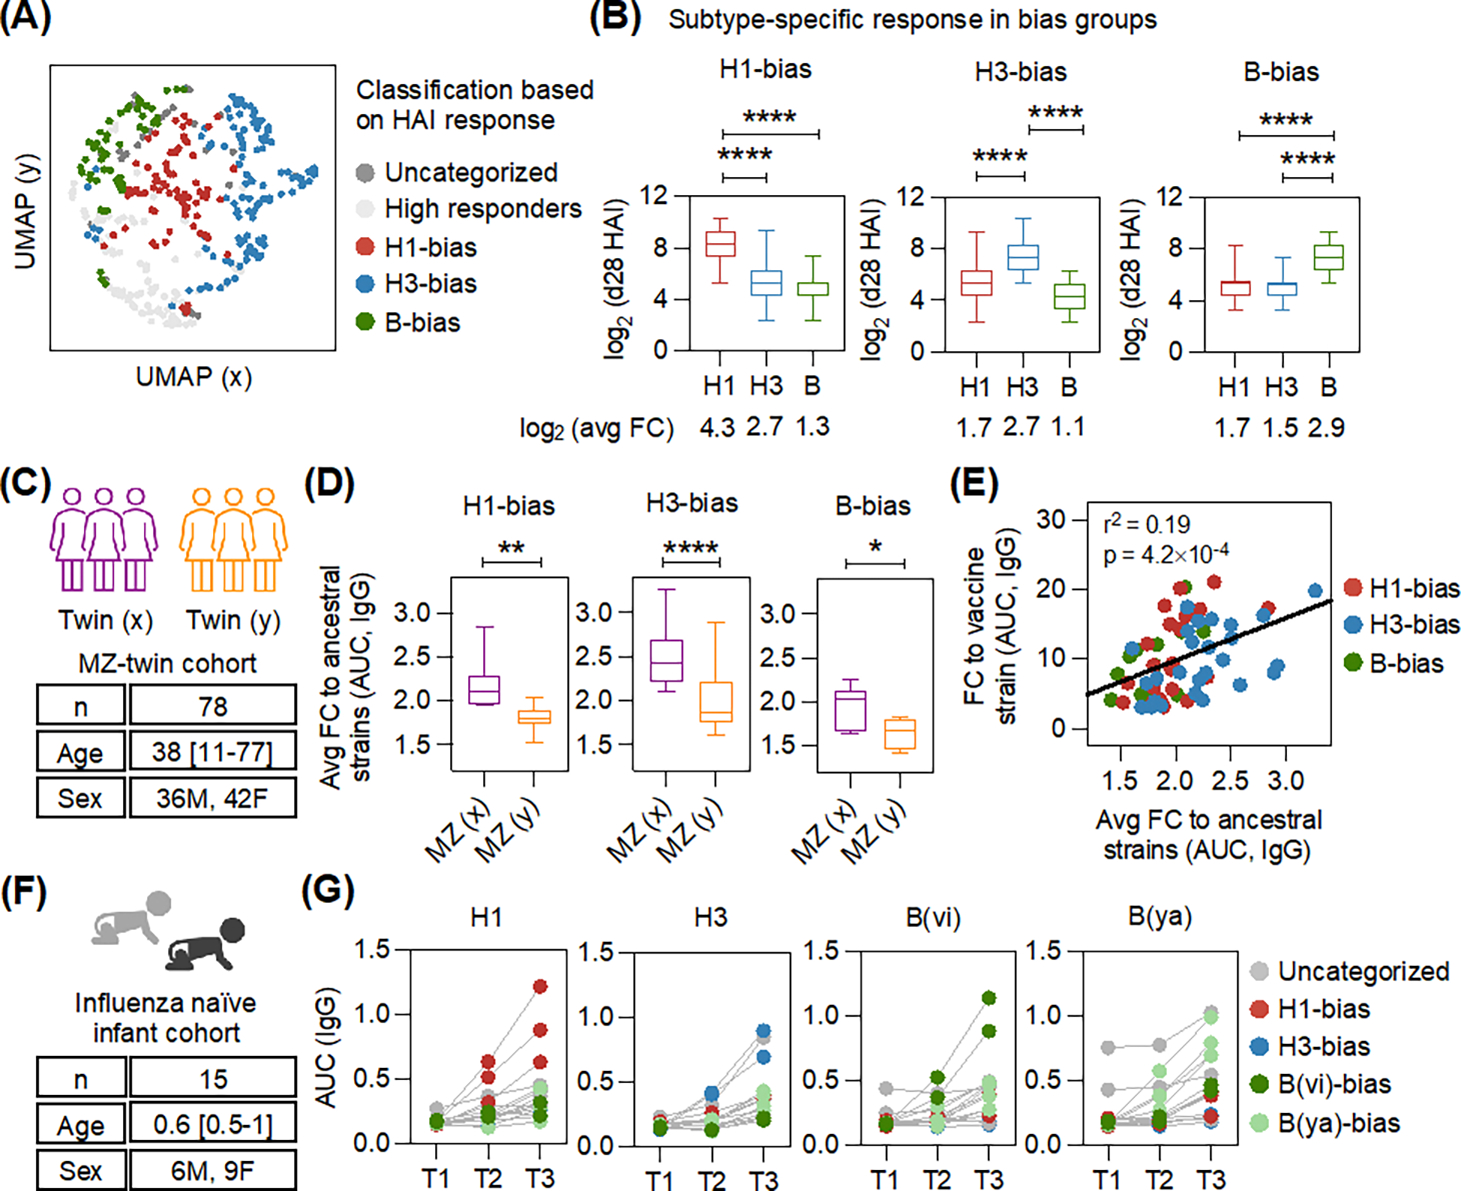
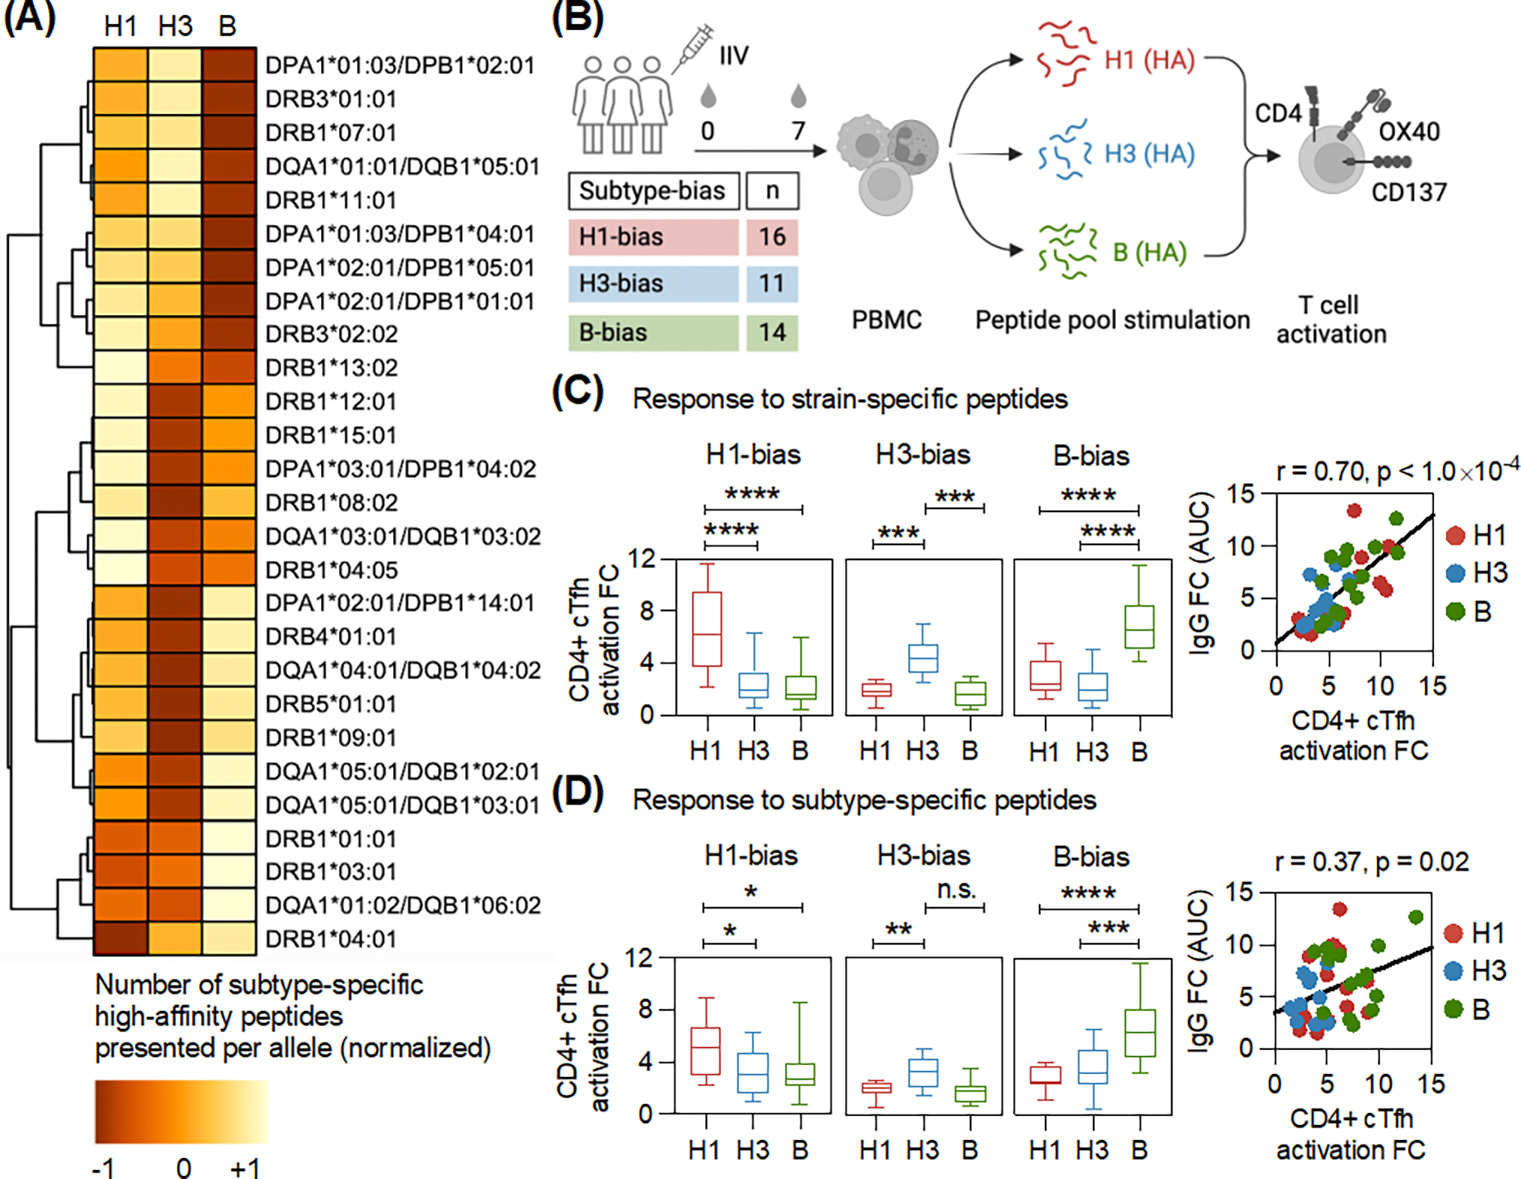
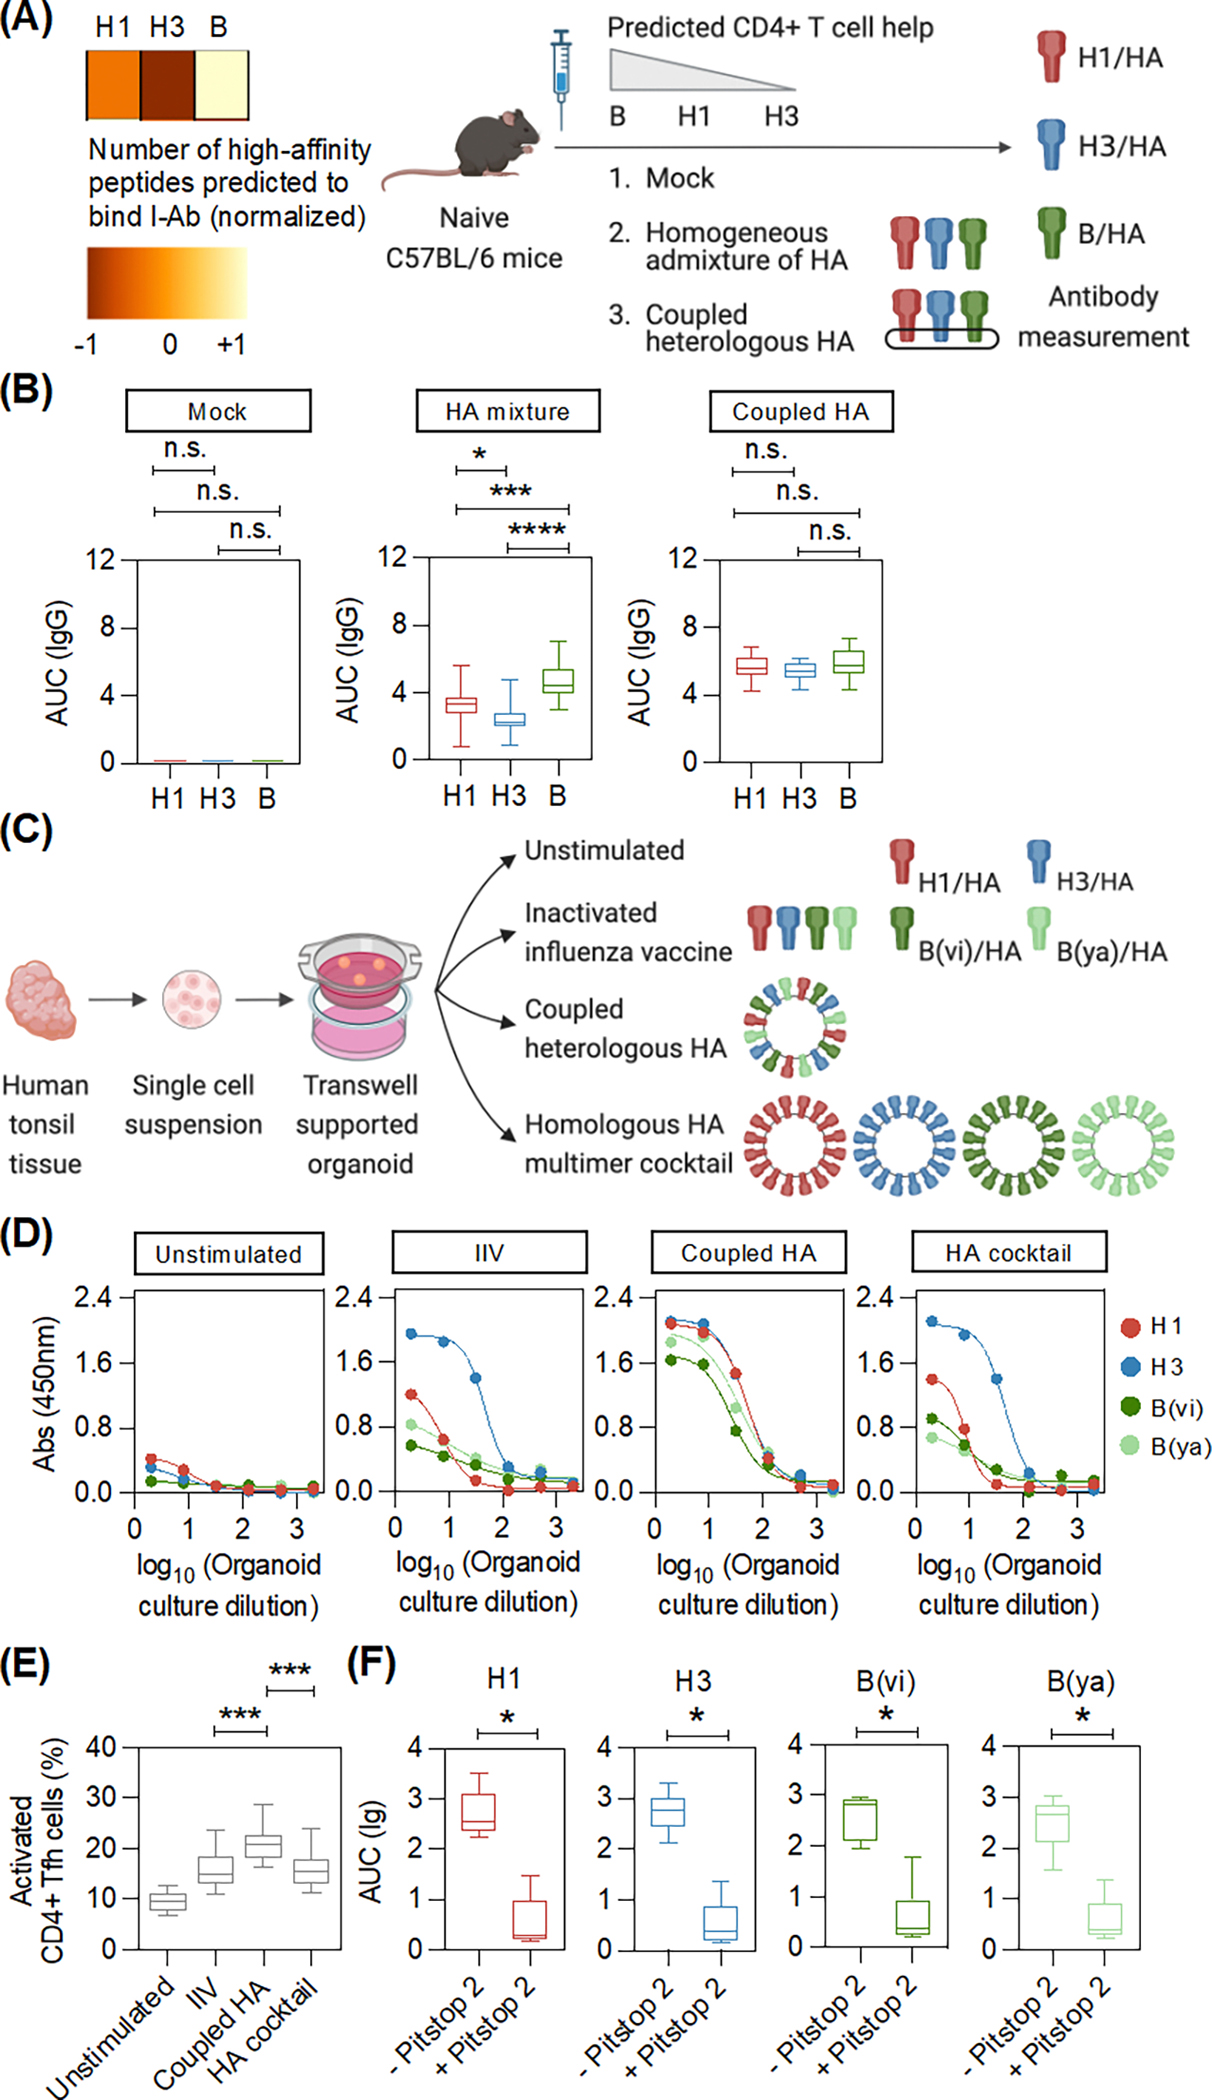
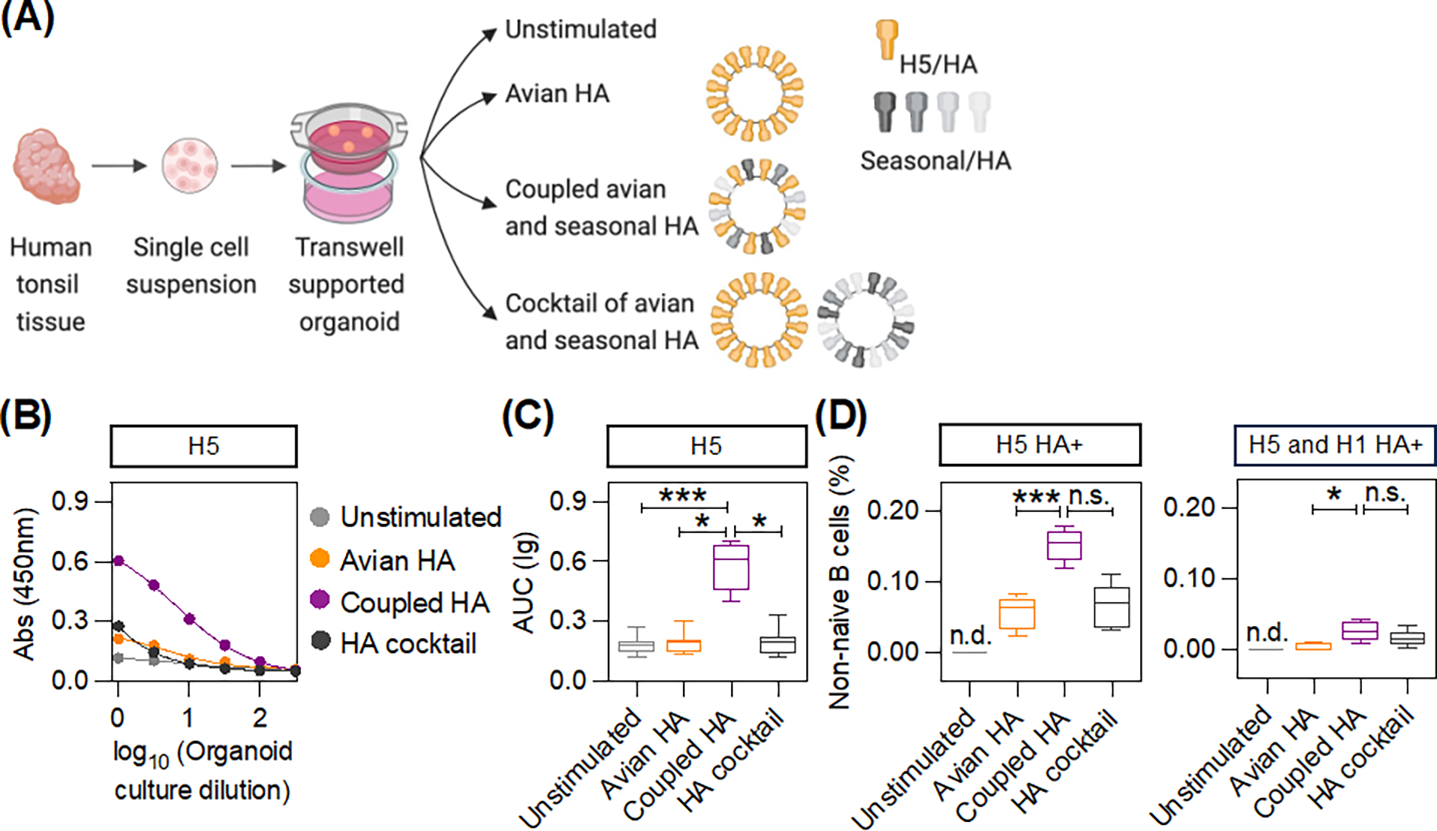
The seasonal influenza vaccine contains strains of viruses from distinct subtypes that are grown independently and then combined. However, most individuals exhibit a more robust response to one of these strains and thus are vulnerable to infection by others. By studying a monozygotic twin cohort, we found that although prior exposure is a factor, host genetics are a stronger driver of subtype bias to influenza viral strains. We found that covalent coupling of heterologous hemagglutinin (HA) from different viral strains could largely eliminate subtype bias in an animal model and in a human tonsil organoid system. We proposed that coupling of heterologous antigens improves antibody responses across influenza strains by broadening T cell help, and we found that using this approach substantially improved the antibody response to avian influenza HA.


Conflict of interest statement

Competing interests: VM and MMD are inventors on a patent application (PCT/US2024/020935) submitted by Stanford Office of Technology Licensing that covers the strategy to broaden T cell help by heterologous antigen coupling described in this work. MMD is a co-founder, stockholder and paid consultant to NextVivo Inc. which has licensed aspects of the organoid technology used here for commercial purposes. LEW and MMD are co-inventors on a patent (US18/094,851) assigned to Stanford University describing the immune organoid methodology. The other authors declare that they have no competing interests.

Figures

Figure 1:
Figure 1:. Host genetics contributes to influenza subtype-bias after vaccination.
(A) The uniform manifold approximation and projection (UMAP) shows heterogeneity in the immune response measured using hemagglutination inhibition (HAI) in a cohort of vaccinated individuals (n = 402). A large fraction (65.9%) clustered into subtype-specific bias groups. (B) Box plots display the day 28 (d28) post-vaccination HAI titers for each group. The mean fold-change (FC) is also indicated. Adjusted p-values were calculated using one-way ANOVA with Dunnett’s test for pairwise comparisons. (C) Characteristics of the monozygotic (MZ)-twin cohort (n = 78, 39 pairs). The age (mean, range) and sex distribution are indicated. Twins were assigned to groups (x) or (y). (D) Box plots show the average antibody response in twins to ancestral influenza strains in each subtype-bias group. The fold-change (FC), day 28 (d28)/day 0 (d0), in response to vaccination was measured by ELISA against full-length HAs (Fig. S7). P-values were calculated using two-tailed paired t-test. (E) Linear regression between subtype-specific responses (FC, d28/d0) against vaccine and ancestral strains determined by ELISA for twins with subtype-bias after vaccination. (F) Characteristics of the influenza naïve infant cohort. The age (mean, range) and sex distribution are indicated. (G) Response to full-length HAs in infants was determined by ELISA, with serum samples collected before influenza antigen exposure (T1) and after vaccination (T2 and T3). Each datapoint shows total binding for each individual subject, colored by subtype-bias observed after vaccination. *p < 0.05, **p < 0.01, ****p < 0.0001.
Figure 2:
Figure 2:. Differences in HA peptide presentation by host MHC-II molecules leads to bias in CD4+ T cell help after vaccination.
(A) The affinity of HA peptides from strains of distinct influenza subtypes (H1, H3 and B) to 27 HLA class-II alleles was predicted using the immune epitope database (IEDB). The heatmap displays the average number of high-affinity peptides predicted for each influenza subtype per HLA-II allele. Normalization was applied to visualize the data across alleles, which show wide variation in the number of predicted peptides. Using the standard settings of the pheatmap package in R, each row was normalized to have a mean of zero and a standard deviation of one. Values closer to +1 indicate a higher number of predicted peptides. (B) PBMCs collected before (day 0, d0) and after (day 7, d7) vaccination from individuals with antibody subtype-bias were stimulated separately with strain- and subtype-specific HA peptide pools to measure CD4+ T cell activation (gating in Fig. S9). PBMCs were also stimulated with DMSO. Box plots show the fold-change (d7/d0) in CD4+ cTfh activation after stimulation with (C) Strain-specific, and (D) Subtype-specific HA peptides for individuals with distinct subtype-bias after vaccination. Adjusted p-values were calculated using one-way ANOVA with Dunnett’s test for pairwise comparisons. The scatter plot shows the antibody binding titer (d28/d0) and the corresponding CD4+ cTfh activation (d7/d0) against the preferred vaccine strain in response to vaccination in individuals with subtype-bias. Each dot shows the data from one individual. Pearson correlation was calculated. *p < 0.05, **p < 0.01, ***p < 0.001, ****p < 0.0001, and not significant (n.s.).
Figure 3:
Figure 3:. Covalent coupling of heterologous HA antigens can largely eliminate subtype-bias.
(A) The number of peptides from each influenza subtype (H1, H3, and B) that can bind to MHC-II I-Ab with high-affinity was predicted using the immune epitope database (IEDB). Data was normalized for representation in a heatmap. Naïve, male C57BL/6 mice (5–6 weeks old, n = 15) were immunized with the indicated formulations. Serum was collected at day 14 after immunization to determine the anti-HA antibody titers by ELISA. The data was collected from two independent experiments. (B) Box plots show the anti-HA binding against full-length HAs in the indicated groups. Adjusted p-values were calculated using one-way ANOVA with Tukey’s test for pairwise comparisons. (C) Transwell supported organoids were generated using surgically resected human tonsil tissue. Organoids made from each donor were stimulated separately with the indicated formulations. (D) ELISA binding curves of the tonsil organoid culture supernatant with full-length HAs after the indicated stimulation for a representative donor. Each dot shows the absorbance signal (binding) at the indicated organoid culture dilution. (E) Box plots shows the activation of CD4+ Tfh cells (CD38+) after stimulation of the tonsil organoids with the indicated formulations (n = 10) (gating in Fig. S19). Adjusted p-values were calculated using one-way ANOVA with Dunnett’s test for pairwise comparisons. (F) The antibody response in tonsil organoids after coupled heterologous antigen stimulation, with or without Pitstop 2, an inhibitor of receptor-mediated endocytosis, was measured by ELISA (n = 6). Box plots display antibody binding to full-length HA. P-values were calculated using two-tailed Wilcoxon test. *p < 0.05, ***p < 0.001, ****p < 0.0001, and not significant (n.s.).
Figure 4:
Figure 4:. Antibody responses to avian influenza HA can be boosted by borrowing CD4+ T cell help.
(A) Transwell supported organoids were generated using surgically resected human tonsil tissue. Organoids made from each donor were stimulated separately with the indicated formulations. (B) ELISA binding curves of the tonsil organoid culture supernatant with H5 HA after the indicated stimulations for a representative donor. (C) Box plots show the binding to H5 HA after the indicated stimulations across all donors (n = 8). Adjusted p-values were calculated using one-way ANOVA with Dunn’s test for multiple comparisons. (D) The frequency of H5 HA+ and H1 HA+ specific non-naïve B cells in the tonsil organoids was determined using spheromer probes (gating in Fig. S21). Box plots show the frequency of strain-specific (H5 HA+) and cross-reactive (H5 and H1 HA+) B cells after the indicated stimulations (n = 5). Not determined (n.d.). Adjusted p-values were determined using one-way ANOVA with Dunn’s test for multiple comparisons. *p < 0.05, ***p < 0.001, and not significant (n.s.).

Similar articles

Cited by

References

    1. Iuliano AD et al., Estimates of global seasonal influenza-associated respiratory mortality: a modelling study. Lancet 391, 1285–1300 (2018). - PMC - PubMed
    1. Rathore U, Kesavardhana S, Mallajosyula VV, Varadarajan R, Immunogen design for HIV-1 and influenza. Biochim Biophys Acta 1844, 1891–1906 (2014). - PubMed
    1. Carrat F, Flahault A, Influenza vaccine: the challenge of antigenic drift. Vaccine 25, 6852–6862 (2007). - PubMed
    1. Schotsaert M, Garcia-Sastre A, Inactivated influenza virus vaccines: the future of TIV and QIV. Curr Opin Virol 23, 102–106 (2017). - PMC - PubMed
    1. Erbelding EJ et al., A Universal Influenza Vaccine: The Strategic Plan for the National Institute of Allergy and Infectious Diseases. J Infect Dis 218, 347–354 (2018). - PMC - PubMed

Publication types

MeSH terms