. 2025 Mar 14;387(6739):eado5088.
doi: 10.1126/science.ado5088. Epub 2025 Mar 14.

Identification of antigen-presenting cell-T cell interactions driving immune responses to food

Affiliations

Identification of antigen-presenting cell-T cell interactions driving immune responses to food

Maria Cecilia Campos Canesso et al. Science. .

Abstract

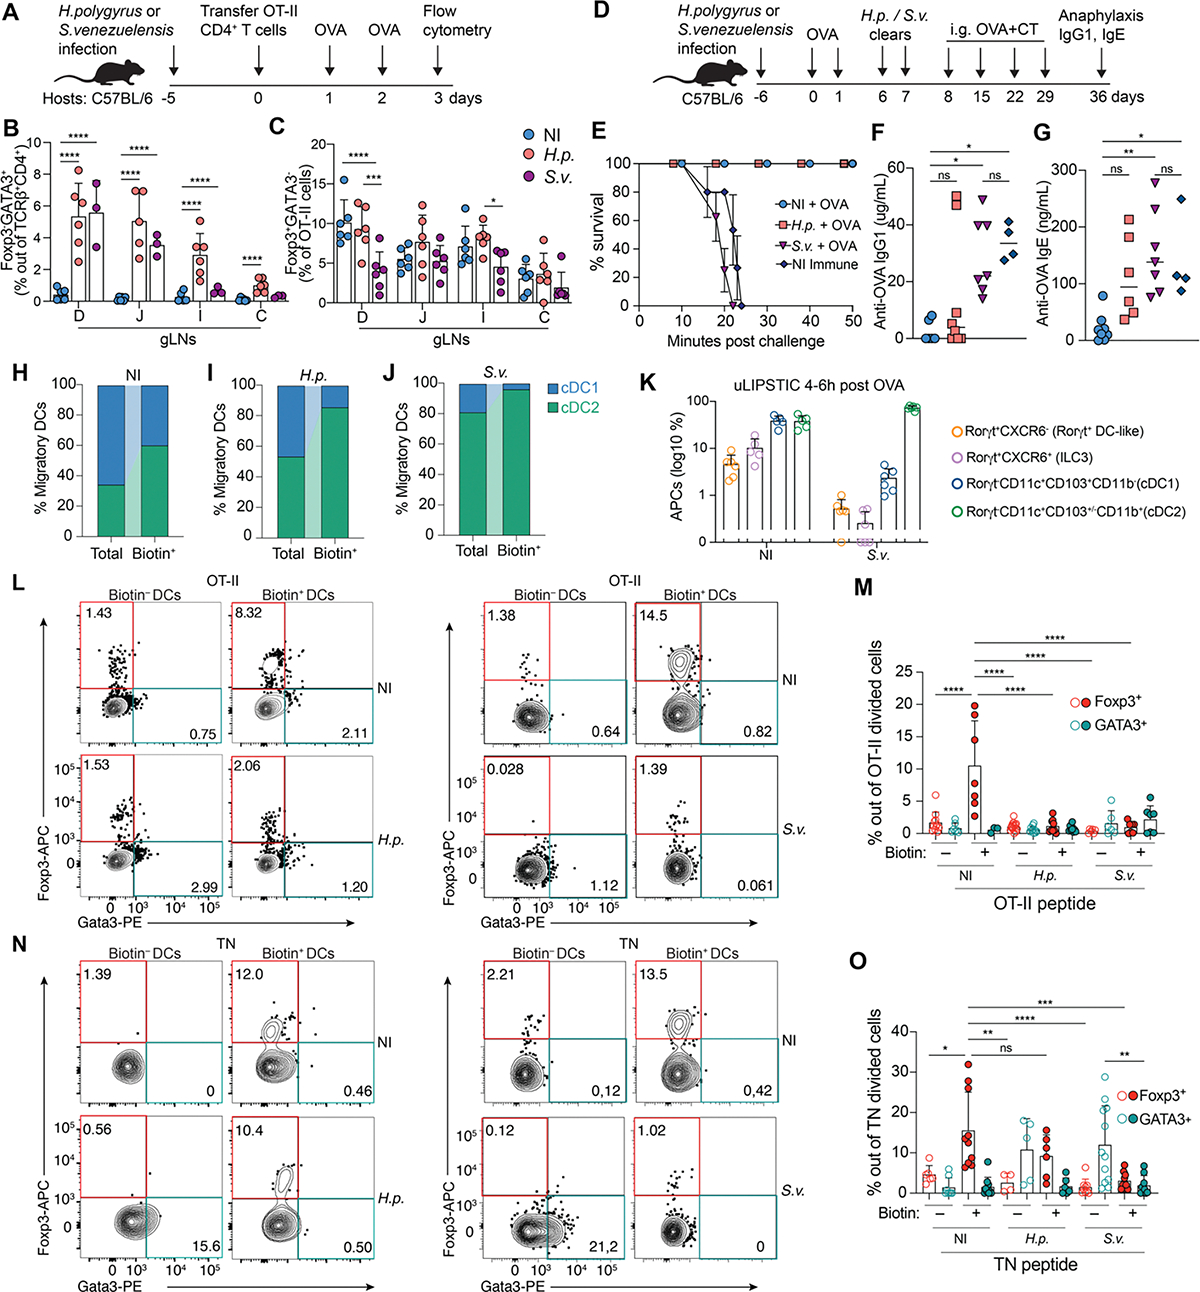
The intestinal immune system must concomitantly tolerate food and commensals and protect against pathogens. Antigen-presenting cells (APCs) orchestrate these immune responses by presenting luminal antigens to CD4+ T cells and inducing their differentiation into regulatory (peripheral regulatory T cell) or inflammatory [T helper (Th) cell] subsets. We used a proximity labeling method (LIPSTIC) to identify APCs that presented dietary antigens under tolerizing and inflammatory conditions and to understand cellular mechanisms by which tolerance to food is induced and can be disrupted by infection. Helminth infections disrupted tolerance induction proportionally to the reduction in the ratio between tolerogenic APCs-including migratory dendritic cells (cDC1s) and Rorγt+ APCs-and inflammatory APCs, which were primarily cDC2s. These inflammatory cDC2s expanded by helminth infection did not present dietary antigens, thus avoiding diet-specific Th2 responses.


Conflict of interest statement

Competing interests:

G.D.V. has a U.S. patent on LIPSTIC technology (US10053683) and is a scientific advisor for Vaccine Company Inc. The other authors declare that they have no competing interests.

Figures

Figure 1.
Figure 1.. Using LIPSTIC to identify DCs presenting dietary antigens in the gLNs.
(A) Schematic representation of LIPSTIC labeling of intercellular contacts in vivo. (B, C, F-J) CD45.2 Cd40G5/G5 mice were adoptively transferred with 1 × 10⁶ naive CD45.1 CD4+ Cd40lgSrtA/Y OT-II T cells prior to one dose of intragastric PBS, OVA or OVA + anti CD40L antibody. Cell-cell interaction was revealed by LIPSTIC protocol 24 h later. (B) Experimental setup for panel c. (C) Representative flow plots showing percentage of labeled DCs in the duodenal gLNs (D-gLNs) (left) and quantification of data (right) (n = 3, 4 mice per group, pool of two independent experiments). (D, E) Mixed bone marrow chimera (BMC) mice reconstituted with Cd40G5/G5 and Cd40G5/G5:H2−/− cells. Mice were adoptively transferred with 1 × 10⁶ naïve CD4+ Cd40lgSrtA/Y OT-II T cells prior to one dose of intragastric OVA. Cell-cell interaction was revealed by LIPSTIC protocol 24 h later. (D) Experimental setup for panel (E). (E) Representative flow plots showing percentage of labeled DCs (n = 4 mice per group, representative of two independent experiments). (F, G) Sorted D-gLNs biotin or biotin+ DCs or DCs derived from OVA-naive mice were co-culture in vitro with naïve OT-II CFSE-labeled T cells for 96 h prior analysis. (F) Representative flow plots showing proliferation of OT-II T cells co-cultured with biotin or biotin+ DCs (left) and quantification of OT-II T cells per well at the end of the culture period with indicated DCs (right). (G) Percentage of Foxp3+ cells among proliferated OT-II T cells co-culture with biotin or biotin+ DCs. Each dot represents one mouse (n = 3 to 5 mice per group, representative of two independent experiments). (H) Representative flow plots showing percentage of Foxp3+ cells among proliferated OT-II T cells co-culture with biotin or biotin+ DCs in the presence of exogenous OT-II peptide (left), and quantification of data (right). Each dot represents one mouse (n = 3, 4 mice per group, pool of three independent experiments). (I, J) CD45.2 Cd40G5/G5 mice that were adoptively transferred with 1 × 10⁶ naive CD45.1 CD4+ Cd40lgSrtA/Y OT-II T cells prior to one dose of intragastric OVA. Analyses were carried out 24 h later. (I) Representative flow plots showing gating on resident and migratory DCs in D-gLNs (left), percentage of labeled resident and migratory DCs in D-gLNs (center), and quantification of data (right). Each dot represents one mouse (n = 3 mice per group, pool of three independent experiments). (J) Percentage of cDC1 and cDC2 out of total migratory DCs (left) and percentage of cDC1 and cDC2 out of biotin+ DCs (right). Each dot represents one mouse (n = 3 mice per group, pool of three independent experiments). cDC1s were defined as Aqua CD45.2+ CD45.1 LinCD11chi MHC-IIhi CD103+ CD11b and cDC2s were defined as Aqua CD45.2+ CD45.1 Lin CD11chiMHC-IIhi CD103+/− CD11b. D, duodenum; J, jejunum; I, ileum; C, colon. In graphs, the height of bars indicate mean, and error bars indicate SD. P-values were calculated by one-way ANOVA in (C), two-way ANOVA in (E), (F), and (J) or unpaired t-test in (G) and (I). Statistical significance denoted as not significant (ns), *P < 0.05, **P < 0.01, ***P < 0.001, ****P < 0.0001.
Figure 2.
Figure 2.. Biotin+ cDC1 contribute to food-specific pTreg differentiation.
(A to F) CD45.2 Cd40G5/G5 mice were adoptively transferred with 1 × 10⁶ naive CD45.1 CD4+ Cd40lgSrtA/Y OT-II T cells prior to one dose of intragastric OVA. Cell-cell interaction was revealed by LIPSTIC protocol 24 h later. Biotin and biotin+ D-gLNs DCs were single-cell sorted and subjected to scRNA-seq (263 cells were analyzed). (A) Uniform manifold approximation and projection (UMAP) plot. Cells were pooled from 7 mice from 2 independent experiments. Dotted line indicates the location of resident/migratory DC boundary. (B) Distribution of biotin (grey) and biotin+ (red) DCs. Dotted lines indicate the location of Cluster 0 and 1. (C) Proportion of cells in each transcriptional cluster among biotin and biotin+ DCs. (D) Expression of genes significantly upregulated in both biotin+ cDC1 and cDC2 compared to biotin cDC1 and cDC2. (E, F) OT-II CFSE- or CTV-labeled T cells were co-cultured in vitro with sorted biotin DCs, biotin+ cDC1s or biotin+ cDC2s from D-gLNs in the presence of exogenous OT-II peptide for 96 h. Representative flow plots showing percentage of Foxp3+ or Fr4+Thlin− cells among proliferated OT-II T cells (left), and quantification of data (right). Each dot represents one mouse (n = 3, 4 mice per group, pool of four independent experiments). (G, H) CD45.2 Clec9a+/+H2-Ab1fl/fl or Clec9acreH2-Ab1fl/fl mice; or bone marrow chimera (BMC) mice reconstituted with C57BL/6 (WT) or Δ1+2+3 cells were adoptively transferred with 1 × 10⁶ naive CD45.1 CD4+ OT-II T cells. Mice received two doses of intragastric OVA 48 h and 24 h prior analysis. Percentage of Foxp3+ or Fr4+Thlin− cells among CD45.1 TCRV 2+ (OT-II) T cells in D-gLNs (n = 3 mice per group, pool of two or three independent experiments). (I to L) CD45.2 Rosa26uLIPSTIC/uLIPSTIC mice were adoptively transferred with 3 × 10⁶ naive CD45.1 Cd4Cre.Rosa26uLIPSTIC/uLIPSTIC OT-II T cells prior to one dose of intragastric OVA. Cell-cell interaction was revealed by LIPSTIC protocol at indicated time-points post oral OVA administration. (I) Representative flow plots showing percentage of labeled APCs in the D-gLNs at 4–6 h or 22–24 h after i.g. OVA. (J, K) Percentage of different APCs Biotin+ cells among MHC-II+ cells. (L) Percentage of Biotin+ APCs 4–6h post i.g. OVA with or without MHC-II blocking. (n = 3, 4 mice per group, pool of two or three independent experiments). cDC1s were defined as Aqua CD45.2+ CD45.1 LinCD11chi MHC-IIhi CD103+ CD11b and cDC2s were defined as Aqua CD45.2+ CD45.1 Lin CD11chi MHC-IIhi CD103+/− CD11b. In all graphs, the height of bars indicate mean, and error bars indicate SD. Wilcoxon signed-rank test was used for (D). P-values were calculated by one-way ANOVA in (E) and (F), or by unpaired t-test in (G) and (H). Statistical significance denoted as not significant (ns), ***P < 0.001. N.d = not detected.
Figure 3.
Figure 3.. Helminthic infections affect food-specific pTreg induction by DCs.
(A to C) CD45.2 C57BL/6 mice were infected with S. venezuelensis (S.v.) or H. polygyrus (H.p.) 5 days prior adoptively transfer of 1 × 10⁶ naive CD45.1 CD4+ OT-II T cells. Mice received two doses of intragastric OVA 48 h and 24 h prior analysis. Non-infected mice (NI) were used as control. (A) Experimental setup for panel (B, C). Percentage of (B) GATA3+ cells among CD45.2 TCRβ+CD4+ T cells and (C) Foxp3+ cells among CD45.1 TCRVα2+ (OT-II) T cells in gLNs. (n = 3 mice per group, pool of two independent experiments). (D) Experimental setup for panel (E-G). (E) Anaphylaxis as measured by survival of mice at the indicated times after intraperitoneal OVA injection (challenge), following four weekly doses of OVA+cholera toxin (CT). (F) OVA-specific IgG1 or (G) OVA-specific IgE levels in serum as measured by ELISA (n = 3, 4 mice per group, pool of three independent experiments). (H to J) CD45.2 Cd40G5/G5 mice were adoptively transferred with 1 × 10⁶ naive CD45.1 CD4+ Cd40lgSrtA/Y OT-II T cells prior to one dose of intragastric OVA. Cell-cell interaction was revealed by LIPSTIC protocol 24 h later. Non-infected mice (NI) were used as control. Percentage of cDC1 and cDC2 out of total migratory DCs (left bar) and percentage of cDC1 and cDC2 out of biotin+ DCs (right bar) of NI, H.p- or S.v-infected mice. (K) CD45.2 Rosa26uLIPSTIC/uLIPSTIC mice were infected with S.v. 5 days prior adoptively transfer of 3 × 10⁶ naive CD45.1 Cd4Cre.Rosa26uLIPSTIC/uLIPSTIC OT-II T cells. Mice received one dose of intragastric OVA and cell-cell interaction was revealed by LIPSTIC protocol 4 h later. (K) Percentage of Biotin+ APCs among MHC-II+ cells. (L to O) Sorted biotin or biotin+ DCs from D-gLNs of non-infected mice (NI) or mice infected with H.p (left) or S.v (right) were co-culture with OT-II CFSE-labeled T cells (L, M) or TN CFSE-labeled T cells (N, O) in vitro for 96 h. (L, N) Representative flow plots showing percentage of Foxp3+ and GATA3+ cells among proliferated T cells co-cultured with biotin or biotin+ DCs from NI, H.p (left) or S.v (right) infected mice and (M, O) quantification of data. OT-II or TN peptide were added to the corresponding co-cultures wells. Each dot represents one mouse (n = 3, 4 mice per group, pool of three independent experiments). cDC1s were defined as Aqua CD45.2+ CD45.1 Lin CD11chi MHC-IIhi CD103+ CD11b and cDC2s were defined as Aqua CD45.2+ CD45.1 Lin CD11chi MHC-IIhi CD103+/− CD11b. Height of bars indicate mean, and error bars indicate SD. P-values were calculated by two-way ANOVA in (B), (C), (F), (G), (M) and (O). Statistical significance denoted as not significant (ns), *P < 0.05, **P < 0.01, ***P < 0.001, ****P < 0.0001.
Figure 4.
Figure 4.. Helminth infection skews the population of dietary antigen-presenting biotin+ DCs in the D-gLNs.
CD45.2 Cd40G5/G5 mice were infected with S. venezuelensis (S.v.) or H. polygyrus (H.p.) 5 days prior adoptive transfer of 1 × 10⁶ naive CD45.1 CD4+ Cd40lgSrtA/Y OT-II T cells. Animals received 1 dose of intragastric OVA 18 h after OT-II T cells transfer. Cell-cell interaction was revealed by LIPSTIC protocol 24 h after OVA administration. Non-infected (NI) mice were used as control. (A) Biotin_and biotin+ D-gLNs DCs were single-cell sorted and subjected to scRNA-seq (534 cells were analyzed). UMAP plot showing clustering of sequenced DCs of NI mice or mice infected with H.p or S.v. Cells were pooled from 4–7 mice from 2 independent experiments. Distribution of biotin (grey) and biotin+ (red) DCs in the same plot. Dotted lines indicate the location of Cluster 0. (B) Proportion of cells in each transcriptional cluster among biotin and biotin+ DCs. (C) Dot plot showing expression of genes differentially expressed between Clusters. (D) Ratio of cDC1/cDC2 among biotin+ DCs from D-gLNs of NI mice or mice infected with H.p or S.v. (E) Relative frequency (left) and absolute numbers (right) of migratory cDC1 and cDC2 in D-gLNs of naïve C57BL/6 mice or mice infected with S.v. (F) Percentage of Foxp3+ cells among proliferated OT-II CFSE-labeled T cells in vitro after 96 h of co-culture with D-gLN NI or S.v biotin or biotin+ DCs or a combination of NI and S.v DCs (1:1 ratio). (G) Percentage of Foxp3+ cells among proliferated OT-II CFSE-labeled T cells in vitro after 96 h of co-culture with D-gLN NI or S.v. biotin+ cDC1 and cDC2 at indicated ratios. OT-II peptide was added to the co-cultures. Each dot represents one mouse (n = 3 to 5 mice per group, representative of two independent experiments). (H and I) Bone marrow chimera (BMC) mice reconstituted with C57BL/6 (WT) or Δ1+2+3 cells. Mice were infected with S.v. 5 days prior adoptively transfer of 1 × 10⁶ naive CD45.1 CD4+ OT-II T cells. Mice received two doses of intragastric OVA 48 h and 24 h prior analysis. (H) Experimental set up for panel (I). (I) Percentage of Foxp3+ cells among CD45.1 TCRVα2+ (OT-II) T cells (right) and percentage of GATA3+ cells among CD45.2 TCRβ+CD4+ T cells (left) in D-gLNs (n = 3 mice per group, pool of two independent experiments). (J) Experimental setup for panel (K to M). (K) Anaphylaxis as measured by survival of mice at the indicated times after intraperitoneal OVA injection (challenge), following four weekly doses of OVA+cholera toxin (CT). (L) OVA-specific IgG1 or (M) OVA-specific IgE levels in serum as measured by ELISA (n = 3, 4 mice per group, pool of three independent experiments). cDC1s were defined as Aqua CD45.2+ CD45.1 Lin CD11chi MHC-IIhi CD103+ CD11b and cDC2s were defined as Aqua CD45.2+ CD45.1 Lin CD11chi MHC-IIhi CD103+/− CD11b. In graphs, the height of bars indicate mean, and error bars indicate SD. Wilcoxon signed-rank test was used for (C). P-values were calculated by one-way ANOVA in (D), or by two-way ANOVA in (F), (G), (L) and (M), and by unpaired t-test in (I). Statistical significance denoted as not significant (ns), *P < 0.05, **P < 0.01, ***P < 0.001, ****P < 0.0001.

References

    1. Anderson DA 3rd, Dutertre CA, Ginhoux F, Murphy KM, Genetic models of human and mouse dendritic cell development and function. Nature reviews. Immunology 21, 101–115 (2021). - PMC - PubMed
    1. Mayassi T, Barreiro LB, Rossjohn J, Jabri B, A multilayered immune system through the lens of unconventional T cells. Nature 595, 501–510 (2021). - PMC - PubMed
    1. Esterhazy D et al., Compartmentalized gut lymph node drainage dictates adaptive immune responses. Nature 569, 126–130 (2019). - PMC - PubMed
    1. Randolph GJ, Ivanov S, Zinselmeyer BH, Scallan JP, The Lymphatic System: Integral Roles in Immunity. Annu Rev Immunol 35, 31–52 (2017). - PMC - PubMed
    1. Diehl GE et al., Microbiota restricts trafficking of bacteria to mesenteric lymph nodes by CX(3)CR1(hi) cells. Nature 494, 116–120 (2013). - PMC - PubMed

Substances