. 2025 Jan 24;387(6732):413-420.
doi: 10.1126/science.adr6896. Epub 2024 Dec 19.

Affinity maturation of antibody responses is mediated by differential plasma cell proliferation

Affiliations

Affinity maturation of antibody responses is mediated by differential plasma cell proliferation

Andrew J MacLean et al. Science. .

Abstract

Increased antibody affinity over time after vaccination, known as affinity maturation, is a prototypical feature of immune responses. Recent studies have shown that a diverse collection of B cells, producing antibodies with a wide spectrum of different affinities, is selected into the plasma cell (PC) pathway. How affinity-permissive selection enables PC affinity maturation remains unknown. We found that PC precursors (prePCs) expressing high-affinity antibodies received higher levels of T follicular helper cell (TFH cell)-derived help and divided at higher rates compared with their lower-affinity counterparts once they left the germinal center. Our findings indicate that differential cell division by selected prePCs accounts for how diverse precursors develop into a PC compartment that mediates serological affinity maturation.


Conflict of interest statement

Competing interests

MCN is on the scientific advisory board of Celldex Therapeutics. All other authors declare that they have no competing interests.

Figures
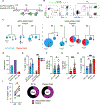
Fig 1.
Fig 1.. High affinity antibody producing PCs are over-represented relative to contemporaneous GC B cells.
(A) Experimental layout for (B-H). (B), Representative flow cytometry plots showing strategy for isolating popliteal LN (pLN) GC B cells (Pre-gated on live, TACI CD138 B220+; CD38Fas+ZSG+) and PCs (Pre-gated on live; CD138+TACI+ZSG+). Full gating strategy is displayed in fig. S2A. (C) Representative IgH+IgL sequence-based phylogenetic trees highlighting GC B cell (blue) and PC (red) distribution. Expanded clones containing (right) or not containing (left) affinity-enhancing mutations. Each circle represents one node of cells with identical sequences. Scale represents mutational distance observed between related sequences. (D) Total numbers of GC-only, PC-only or mixed nodes analyzed. (E) Frequency of GC B (blue bars) or PCs (red bars) found within mixed or single cell-type nodes. Each point represents one animal. (F-G) Node size; number of individual GC B cells (F) or PCs (G) in either uniform or mixed nodes. (H) Frequency of nodes with affinity-enhancing mutations. Each point represents one mouse, summarizing 51–176 nodes per mouse. (I) Frequency of affinity-enhancing mutations within total GC B cells and PCs. Left, summary, each pair of connected points represents GC B cells and PCs isolated from one animal. Right, quantitation of total cells. Numbers in center represent total number of sequences analyzed. * p<0.05, *** p<0.0005. (F,G) ANOVA; (H) mixed effects analysis; (I) paired two-tailed Student’s t-test. Data are pooled from two independent experiments, n=6.
Fig 2.
Fig 2.. High affinity antibody producing PCs are more proliferative.
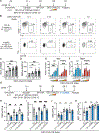
(A) Experimental layout for (B-F). (B) Left, flow cytometry profile showing TACI+CD138+ PCs and gating for mChhi and mChlo cells from pLNs. Right, mChlo and mChhi PC frequency. Each point represents one mouse. Graphs display mean±SD. (C) Clonal distribution of paired Ig sequences (IgH+IgK/IgL) among mChhi and mChlo PCs isolated from each mouse. Colored segments represent expanded clones and singlets are represented by white segments. The number in the center represents the number of sequences analyzed per population. The outer segment annotation denotes the percentage of cells that are members of expanded clones. (D), Chao1 species richness quantification. Each pair of points represents one mouse. (E) Clone size. Each point represents one clone. (F) Frequency of mChhi or mChlo PCs bearing high-affinity IGHV1–72 BCRs. Number in center represents total number of sequences. (G) Summary of (F) each pair of points represents one mouse. (H) Frequency of high affinity mutation containing sequences among IGHV1–72+ expressing mChHi or mChLo PCs. * p<0.05, *** p<0.0005. (B,D,G,H) paired two-tailed Student’s t-test; (E) unpaired Student’s t-test. Data are pooled from 2 independent experiments, n=5.
Fig 3.
Fig 3.. Clonal evolution of the PC repertoire.
(A-B), Confocal microscopy images of pLNs isolated from S1pr2-CreERT2 R26lsl-ZSGreen mice immunized with NP-OVA, treated with tamoxifen on D8 and anti-CD40L or isotype control on D10 and D12. Large tiles show overview of pLN architecture. Inset boxes show individual clusters of dividing Ki67+ NP+ PCs that are highlighted by dashed circles. Individual channels are shown beside merged images. In large tiles, scale bar=100um. In inset boxes, scale bar=30um. (C) Quantitation of fraction of medullary PCs which are Ki67+ amongst NP+ and NP populations, as quantified from confocal images as in (A). The number in the center represents the number of cells analyzed per population. (D) Summary of (C); each point represents one mouse. Graph displays mean±SD. *p<0.05, **p<0.005; ordinary one-way ANOVA. Data are representative of three experiments, n=3–4 per group.
Fig 4.
Fig 4.. Serological affinity maturation.
(A) Experimental layout for (B-G). (B) Clonal distribution of paired Ig sequences from representative mice. Colored segments represent expanded clones and singlets are represented by white segments. The number in the center represents the number of sequences analyzed per population. The outer segment annotation denotes the percentage of cells that are members of expanded clones. (C) Frequency of ZSG+ PCs expressing IGHV1–72. The number in the center represents the number of sequences analyzed. (D) Number of ZSG+ PCs in each experimental group. (E) Summary of IGHV1–72 frequency presented in (C). (F) Chao1 species richness. In D-F, each point represents one mouse, n=4 −5 per condition. (G) Number of VH+VL mutations in paired Ig sequences. Each point represents one cell. (H), Experimental layout for (I-J). (I) Ratio of NP7/NP28-binding IgG in serum measured by ELISA. (J) Fold change in affinity (NP7/NP28 ratio) at D32 vs D11. Data are presented as mean±SD. Data are representative of two experiments, n=5–10 per group. * p<0.05, ** p<0.005. **** p<0.0001. (D-F) ordinary one-way ANOVA; (G) Kruskal-Wallis test. (I-J), mixed effects analysis. For full statistical comparisons see Supplementary Fig.4E.
Fig 5.
Fig 5.. PC proliferation is proportional to signal strength.
(A) Experimental outline for (A-F). (B) Representative flow cytometry plots showing GC B cells (B220+CD38Fas+, top) and prePCs (B220+CD38Fas+CD138+, bottom), after treatment with different ratios of anti-DEC-OVA:CS. (C-D) Quantitation of DECwt GC B cells (C) and prePCs (D) 24h after anti-DEC treatment. (E-F) qPCR of sorted DECwt GC LZ (CD86+CXCR4 GC B) and prePC (as above) showing GAPDH-normalized relative expression for Myc (E) and Tfap4 (F). Data in (A-D) and (E-F) are representative of 3 independent experiments, n=6–8 per group. (G) Experimental outline for (H-K). (H-I) Quantitation of DECWT GC B cells (H) and Ki67+ DECWT GC B cells (I). (J-K) Quantitation of DECWT PCs (J) and Ki67+ DECWT PCs (K). Data are presented as mean±SD. Each point in C,D, H-K represents one mouse. Data in (H-K) are representative of 4 independent experiments. * p<0.05, ** p<0.005. (C) ANOVA; (D, H-K) Kruskal-Wallis test.

Update of

References

    1. Paus D et al. , Antigen recognition strength regulates the choice between extrafollicular plasma cell and germinal center B cell differentiation. J Exp Med 203, 1081–1091 (2006). - PMC - PubMed
    1. Chan TD et al. , Antigen affinity controls rapid T-dependent antibody production by driving the expansion rather than the differentiation or extrafollicular migration of early plasmablasts. J Immunol 183, 3139–3149 (2009). - PubMed
    1. Phan TG et al. , High affinity germinal center B cells are actively selected into the plasma cell compartment. J Exp Med 203, 2419–2424 (2006). - PMC - PubMed
    1. Crotty S, T Follicular Helper Cell Biology: A Decade of Discovery and Diseases. Immunity 50, 1132–1148 (2019). - PMC - PubMed
    1. Finkin S, Hartweger H, Oliveira TY, Kara EE, Nussenzweig MC, Protein Amounts of the MYC Transcription Factor Determine Germinal Center B Cell Division Capacity. Immunity 51, 324–336 e325 (2019). - PMC - PubMed