. 2025 Feb:79:103457.
doi: 10.1016/j.redox.2024.103457. Epub 2024 Dec 5.

HDAC6 inhibitor-loaded brain-targeted nanocarrier-mediated neuroprotection in methamphetamine-driven Parkinson's disease

Affiliations

HDAC6 inhibitor-loaded brain-targeted nanocarrier-mediated neuroprotection in methamphetamine-driven Parkinson's disease

Khang-Yen Pham et al. Redox Biol. 2025 Feb.

Abstract

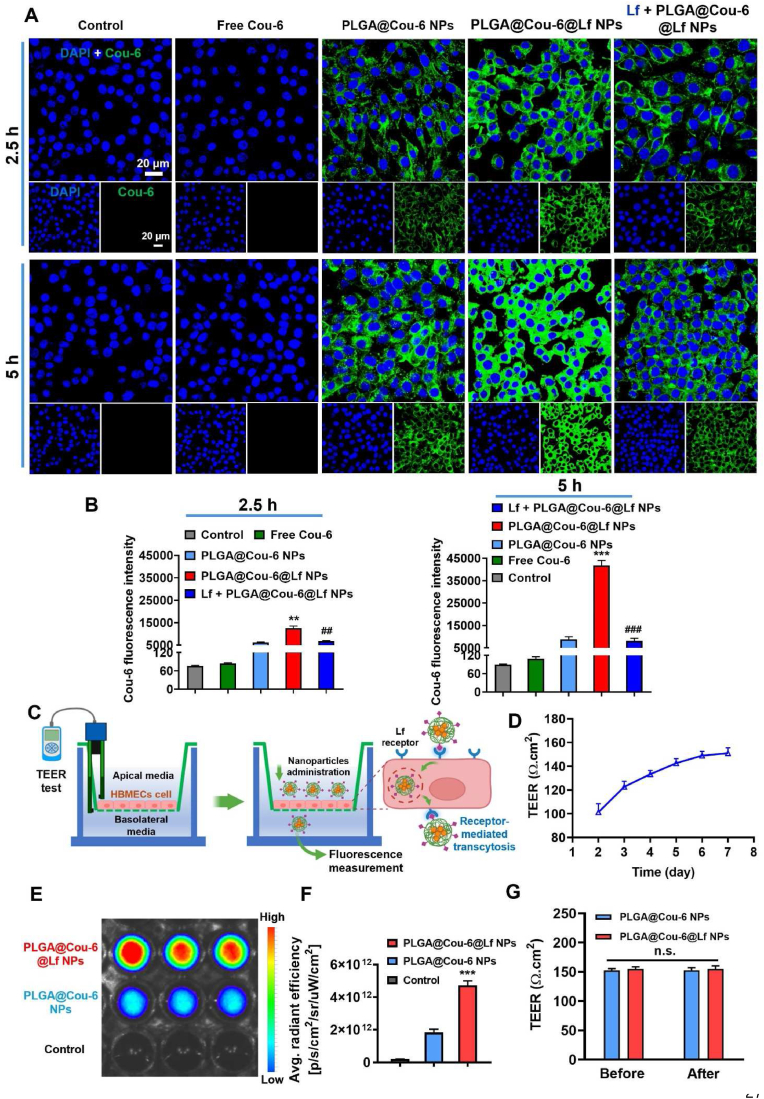
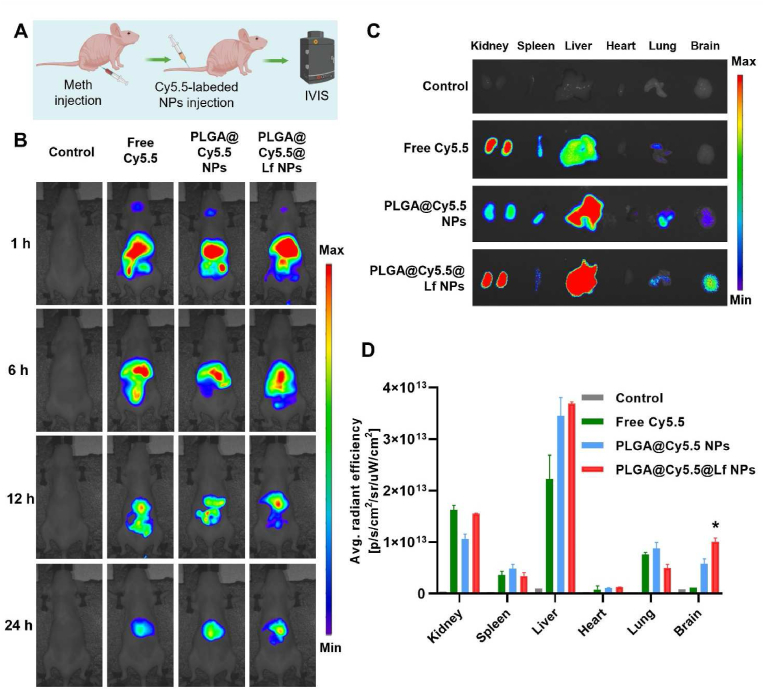
The dynamic equilibrium between acetylation and deacetylation is vital for cellular homeostasis. Parkinson's disease (PD), a neurodegenerative disorder marked by α-synuclein (α-syn) accumulation and dopaminergic neuron loss in the substantia nigra, is associated with a disruption of this balance. Therefore, correcting this imbalance with histone deacetylase (HDAC) inhibitors represents a promising treatment strategy for PD. CAY10603 (CAY) is a potent and selective HDAC6 inhibitor. However, because of its poor water solubility and short biological half-life, it faces clinical limitations. Herein, we engineered lactoferrin-decorated CAY-loaded poly(lactic-co-glycolic acid) nanoparticles (denoted as PLGA@CAY@Lf NPs) to effectively counter methamphetamine (Meth)-induced PD. PLGA@CAY@Lf NPs showed enhanced blood-brain barrier crossing and significant brain accumulation. Notably, CAY released from PLGA@CAY@Lf NPs restored the disrupted acetylation balance in PD, resulting in neuroprotection by reversing mitochondrial dysfunction, suppressing reactive oxygen species, and inhibiting α-syn accumulation. Additionally, PLGA@CAY@Lf NPs treatment normalized dopamine and tyrosine hydroxylase levels, reduced neuroinflammation, and improved behavioral impairments. These findings underscore the potential of PLGA@CAY@Lf NPs in treating Meth-induced PD and suggest that an innovative HDAC6-inhibitor-based strategy can be used to treat PD.

Keywords: CAY10603; HDAC6 inhibitor; Lactoferrin; PLGA nanoparticle; Parkinson's disease.


Conflict of interest statement

Declaration of competing interest The authors declare that they have no known competing financial interests or personal relationships that could have appeared to influence the work reported in this paper.

Figures

Image 1
Graphical abstract
Scheme 1
Scheme 1
Schematic of the (A) formation and (B) application of PLGA@CAY@Lf NPs for treating PD. CAY, which is released from PLGA@CAY@Lf NPs, corrects the acetylation imbalance in the context of PD. Consequently, it exhibits neuroprotective effects by reversing mitochondrial dysfunction, suppressing ROS, and inhibiting α-syn accumulation in a Meth-induced PD model.
Fig. 1
Fig. 1
Characterization of PLGA@CAY@Lf NPs. TEM images of (A) PLGA@CAY NPs and (B) PLGA@CAY@Lf NPs. (C) Hydrodynamic particle size, PDI, and zeta potential measurements for PLGA NPs, PLGA@CAY NPs, and PLGA@CAY@Lf NPs. (D) Stability profiles of PLGA@CAY@Lf in various environments. (E) Calculation of the LC% and EE% of CAY in PLGA@CAY NPs. (F) Calculation of Lf conjugation on NPs. (G) Release profiles of CAY from PLGA@CAY NPs and PLGA@CAY@Lf NPs at pH 7.4. (H) Proposed mechanism of CAY release. ∗p < 0.05 vs. the PLGA@CAY NPs group. Data are presented as mean ± SD (n = 3).
Fig. 2
Fig. 2
Cellular uptake and BBB transportation of PLGA@Cou-6@Lf NPs. (A) CLSM images and (B) flow cytometry analysis for the uptake of PLGA@Cou-6@Lf NPs by SH-SY5Y cells at different incubation times (2.5 and 5 h). (C) An in vitro BBB model was established using HBMECs. (D) TEER value recorded over seven days of cell growth. (E, F) PLGA@Cou-6@Lf NPs crossed the in vitro BBB model after 5 h of incubation. (G) TEER values of the HBMEC monolayer before and after transport. ∗∗p < 0.01, ∗∗∗p < 0.001 vs. the PLGA@Cou-6 NPs group and ##p < 0.01, ###p < 0.001 vs. the PLGA@Cou-6@Lf NPs group. n.s., not significant. Data are presented as mean ± SD (n = 3).
Fig. 3
Fig. 3
In vitro neuroprotective effect of PLGA@CAY@Lf NPs on SH-SY5Y cells exposed to Meth. (A) Neurotoxicity assessment at various concentrations of Meth. (B) Cytotoxicity evaluation of CAY nanoformulations. Cell viability after pretreatment with CAY nanoformulations for 5 h, followed by 24-h Meth exposure using (C) CCK-8 test and (D) live/dead staining. (E, F) JC-1 test to determine MMP in cells pretreated with CAY nanoformulations for 5 h followed by 24-h Meth exposure. (G) JC-1 fluorescence intensity ratios. (H, I) Detection of ROS production in cells after pretreatment with CAY nanoformulations for 5 h and subsequent Meth exposure for 24 h using DCFH-DA assay. (J) DCF fluorescence intensity. ∗∗∗p < 0.001, ∗∗∗∗p < 0.0001 vs. the control group; #p < 0.05, ##p < 0.01, ###p < 0.001 vs. the Meth group; and $p < 0.05 vs. the PLGA@CAY NPs group. Data are presented as mean ± SD (n = 4).
Fig. 4
Fig. 4
Effect of PLGA@CAY@Lf NPs on reversing α-tubulin deacetylation and inhibiting abnormal α-syn accumulation in a Meth-induced PD model in vitro. (A) PLGA@CAY@Lf NPs reversed Meth-induced α-tubulin deacetylation. (B) PLGA@CAY@Lf NPs inhibited α-syn accumulation caused by Meth. Fluorescence intensity quantifications of (C) acetyl α-tubulin and (D) α-syn. ∗∗∗p < 0.001 vs. the control group; ##p < 0.01, ###p < 0.001, ####p < 0.0001 vs. the Meth group; and $p < 0.05 vs. the PLGA@CAY NPs group. Data are presented as mean ± SD (n = 3).
Fig. 5
Fig. 5
Brain targeting and biodistribution of PLGA@Cy5.5@Lf NPs. (A) Administration of nanoformulations via intravenous tail vein injections to mice with PD for biodistribution studies. (B) Whole-body biodistribution of NPs. (C) Ex vivo imaging of NPs accumulation in the brain and other major organs. (D) Quantification of NPs accumulation. ∗p < 0.05 vs. the PLGA@Cy5.5 NPs group. Data are presented as mean ± SD (n = 4).
Fig. 6
Fig. 6
The dopaminergic neuroprotective effects of the CAY formulation against the Meth-induced PD. (A) Experimental approach for treating Meth-induced PD. Behavioral analyses for the (B) challenging beam test and (C) cylinder test. Neurochemical analyses for (D) DA and (E) DOPAC levels. Immunostaining of TH+ fibers in (F) dopaminergic neurons and (H) striatum. Scale bar: 150 μm (40 × ), 50 μm (100 × ), and 12.5 μm (200 × ). Quantitative assessment of TH+ staining in (G) dopaminergic neurons and (I) striatum. ∗∗∗p < 0.001, ∗∗∗∗p < 0.0001 vs. the control group; #p < 0.05, ##p < 0.01, ###p < 0.001 vs. the Meth group; $p < 0.05, $$p < 0.01, $$$p < 0.001 vs. the free CAY + Meth group; and &p < 0.05, &&p < 0.01 vs. the PLGA@CAY NPs + Meth group. Data are presented as mean ± SD (n = 6).
Fig. 7
Fig. 7
Reversal of α-tubulin deacetylation and inhibition of α-syn accumulation in mice with Meth-induced PD. CLSM images showing (A) the reversal of Meth-induced deacetylation of α-tubulin and (B) the inhibition of abnormal α-syn accumulation. (C) Representative Western blot images showing acetyl-α-tubulin and α-syn levels. Quantitative analyses of (D) acetyl-α-tubulin and (E) α-syn from Western blot analysis. G1, control group; G2, Meth; G3, Free CAY + Meth; G4, PLGA@CAY NPs + Meth; and G5, PLGA@CAY@Lf NPs + Meth. ∗p < 0.05, ∗∗p < 0.01 vs. the control group; ##p < 0.01, ###p < 0.001, ####p < 0.0001 vs. the Meth group; $$p < 0.01, $$$p < 0.001 vs. the free CAY + Meth group; and &p < 0.05, &&p < 0.01 vs. the PLGA@CAY NPs + Meth group. Data are presented as mean ± SD (n = 6).
Fig. 8
Fig. 8
Antineuroinflammatory effects of PLGA@CAY@Lf NPs. Assessment of astrocyte activation in the (A) substantia nigra and (B) striatum. Quantitative assessment of astrocyte activation in (C) substantia nigra dopaminergic neurons and (D) in the striatum. Examination of microglial activation in the (E) substantia nigra and (F) striatum. Scale bar: 150 μm (40 × ), 50 μm (100 × ), and 12.5 μm (400 × ). Quantitative assessment of microglial activation in (G) substantia nigra dopaminergic neurons and (H) in the striatum. ∗∗∗∗p < 0.0001 vs. the control group; ##p < 0.01, ###p < 0.001 vs. the Meth group; $$p < 0.01 vs. the free CAY + Meth group; and &p < 0.05 vs. the PLGA@CAY NPs + Meth group. Data are presented as mean ± SD (n = 6).

References

    1. Wu J., Cui X., Ke P.C., Mortimer M., Wang X., Bao L., Chen C. Nanomaterials as novel agents for amelioration of Parkinson's disease. Nano Today. 2021;41
    1. V Kalia L., Lang A.E. Parkinson's disease. Lancet. 2015;386:896–912. - PubMed
    1. Cheng G., Liu Y., Ma R., Cheng G., Guan Y., Chen X., Wu Z., Chen T. Anti-Parkinsonian therapy: strategies for crossing the blood–brain barrier and nano-biological effects of nanomaterials. Nano-Micro Lett. 2022;14:105. - PMC - PubMed
    1. Liu J., Liu C., Zhang J., Zhang Y., Liu K., Song J.-X., Sreenivasmurthy S.G., Wang Z., Shi Y., Chu C., Zhang Y., Wu C., Deng X., Liu X., Song J., Zhuang R., Huang S., Zhang P., Li M., Wen L., wu Zhang Y., Liu G. A self-assembled α-synuclein nanoscavenger for Parkinson's disease. ACS Nano. 2020;14:1533–1549. - PubMed
    1. Morris H.R., Spillantini M.G., Sue C.M., Williams-Gray C.H. The pathogenesis of Parkinson's disease. Lancet. 2024;403:293–304. - PubMed

MeSH terms

LinkOut - more resources