Machine learning models for diagnosis and risk prediction in eating disorders, depression, and alcohol use disorder
- PMID: 39701465
- PMCID: PMC7617286
- DOI: 10.1016/j.jad.2024.12.053
Machine learning models for diagnosis and risk prediction in eating disorders, depression, and alcohol use disorder
Abstract
Background: Early diagnosis and treatment of mental illnesses is hampered by the lack of reliable markers. This study used machine learning models to uncover diagnostic and risk prediction markers for eating disorders (EDs), major depressive disorder (MDD), and alcohol use disorder (AUD).
Methods: Case-control samples (aged 18-25 years), including participants with Anorexia Nervosa (AN), Bulimia Nervosa (BN), MDD, AUD, and matched controls, were used for diagnostic classification. For risk prediction, we used a longitudinal population-based sample (IMAGEN study), assessing adolescents at ages 14, 16 and 19. Regularized logistic regression models incorporated broad data domains spanning psychopathology, personality, cognition, substance use, and environment.
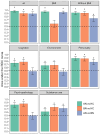
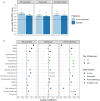
Results: The classification of EDs was highly accurate, even when excluding body mass index from the analysis. The area under the receiver operating characteristic curves (AUC-ROC [95 % CI]) reached 0.92 [0.86-0.97] for AN and 0.91 [0.85-0.96] for BN. The classification accuracies for MDD (0.91 [0.88-0.94]) and AUD (0.80 [0.74-0.85]) were also high. The models demonstrated high transdiagnostic potential, as those trained for EDs were also accurate in classifying AUD and MDD from healthy controls, and vice versa (AUC-ROCs, 0.75-0.93). Shared predictors, such as neuroticism, hopelessness, and symptoms of attention-deficit/hyperactivity disorder, were identified as reliable classifiers. In the longitudinal population sample, the models exhibited moderate performance in predicting the development of future ED symptoms (0.71 [0.67-0.75]), depressive symptoms (0.64 [0.60-0.68]), and harmful drinking (0.67 [0.64-0.70]).
Conclusions: Our findings demonstrate the potential of combining multi-domain data for precise diagnostic and risk prediction applications in psychiatry.
Keywords: Alcohol use disorder; Eating disorders; Major depressive disorder; Predictive modeling; Risk factors.
Copyright © 2024. Published by Elsevier B.V.
Conflict of interest statement
Declaration of competing interest Dr. Banaschewski served in an advisory or consultancy role for Lundbeck, Medice, Neurim Pharmaceuticals, Oberberg GmbH, Shire. He received conference support or speaker's fee by Lilly, Medice, Novartis and Shire. He has been involved in clinical trials conducted by Shire & Viforpharma. He received royalties from Hogrefe, Kohlhammer, CIP Medien, Oxford University Press. Dr. Barker has received honoraria from General Electric Healthcare for teaching on scanner programming courses. Dr. Poustka served in an advisory or consultancy role for Roche and Viforpharm and received speaker's fee by Shire. She received royalties from Hogrefe, Kohlhammer and Schattauer. M. John Broulidakis receives a salary from medical device manufacturer Emteq Labs for which he works as a research scientist. Emteq Labs had no role, financial or otherwise, in the STRATIFY or IMAGEN projects or this paper in particular. Views expressed in this paper do not necessarily reflect those of Emteq Labs. The present work is unrelated to the above grants and relationships. The other authors report no biomedical financial interests or potential conflicts of interest.
Figures


Update of
-
Machine learning models for diagnosis and risk prediction in eating disorders, depression, and alcohol use disorder.Res Sq [Preprint]. 2024 Feb 1:rs.3.rs-3777784. doi: 10.21203/rs.3.rs-3777784/v1. Res Sq. 2024. Update in: J Affect Disord. 2025 Jun 15;379:889-899. doi: 10.1016/j.jad.2024.12.053. PMID: 38352452 Free PMC article. Updated. Preprint.
References
-
- Arcelus J, Mitchell AJ, Wales J, Nielsen S. Mortality rates in patients with anorexia nervosa and other eating disorders. A meta-analysis of 36 studies. Arch Gen Psychiatry. 2011;68:724–731. - PubMed
-
- Babor TF, Higgins-Biddle JC, Saunders JB, Monteiro MG. AUDIT : the Alcohol Use Disorders Identification Test : guidelines for use in primary health care. (second edition) 2001
-
- Bahji A, Mazhar MN, Hudson CC, Nadkarni P, MacNeil BA, Hawken E. Prevalence of substance use disorder comorbidity among individuals with eating disorders: A systematic review and meta-analysis. Psychiatry Res. 2019;273:58–66. - PubMed
-
- Biederman J, Mick E, Faraone SV. Depression in attention deficit hyperactivity disorder (ADHD) children: “True” depression or demoralization? J Affect Disord. 1998;47:113–122. - PubMed
MeSH terms
Grants and funding
- MR/S020306/1/MRC_/Medical Research Council/United Kingdom
- MRF-058-0004-RG-DESRI/MRF_/MRF_/United Kingdom
- MRF-058-0014-F-ZHAN-C0866/MRF_/MRF_/United Kingdom
- R01 MH085772/MH/NIMH NIH HHS/United States
- MR/N000390/1/MRC_/Medical Research Council/United Kingdom
- MR/R00465X/1/MRC_/Medical Research Council/United Kingdom
- U54 EB020403/EB/NIBIB NIH HHS/United States
- 695313/ERC_/European Research Council/International
- MR/W002418/1/MRC_/Medical Research Council/United Kingdom
- R01 DA049238/DA/NIDA NIH HHS/United States
- MRF-058-0009-RG-DESR-C0759/MRF_/MRF_/United Kingdom
- R56 AG058854/AG/NIA NIH HHS/United States
LinkOut - more resources
Full Text Sources
Medical

