. 2024 Nov 22;26(1):bbae667.
doi: 10.1093/bib/bbae667.

Higher order interaction analysis quantifies coordination in the epigenome revealing novel biological relationships in Kabuki syndrome

Affiliations

Higher order interaction analysis quantifies coordination in the epigenome revealing novel biological relationships in Kabuki syndrome

Sara Cuvertino et al. Brief Bioinform. .

Abstract

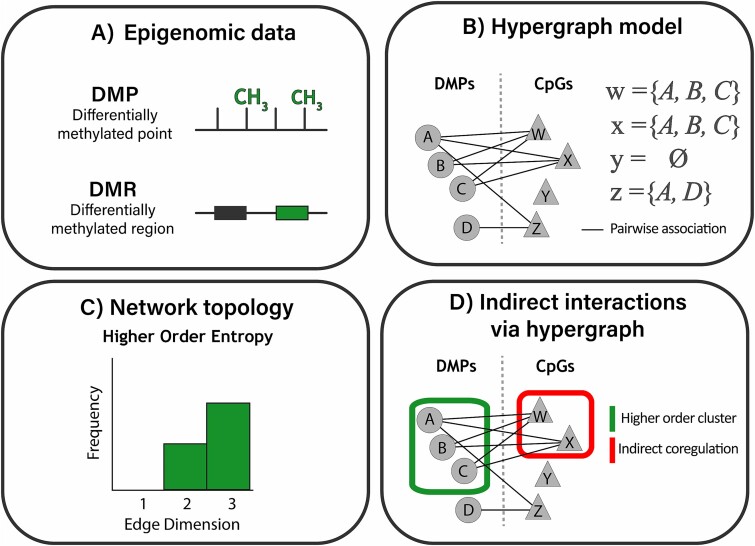
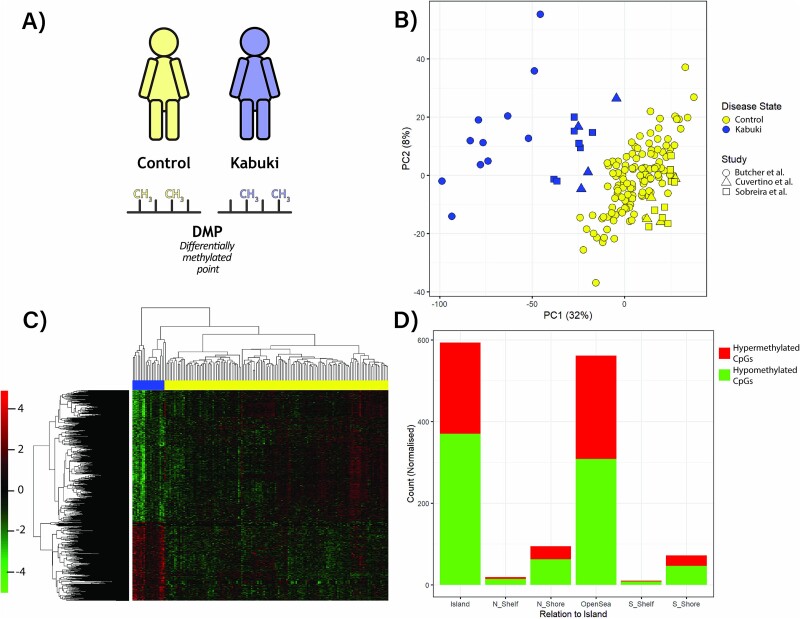
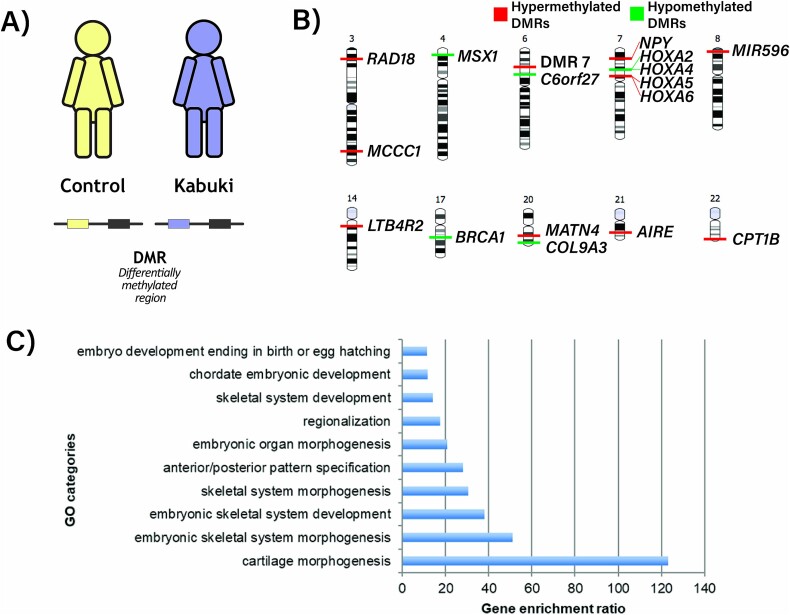
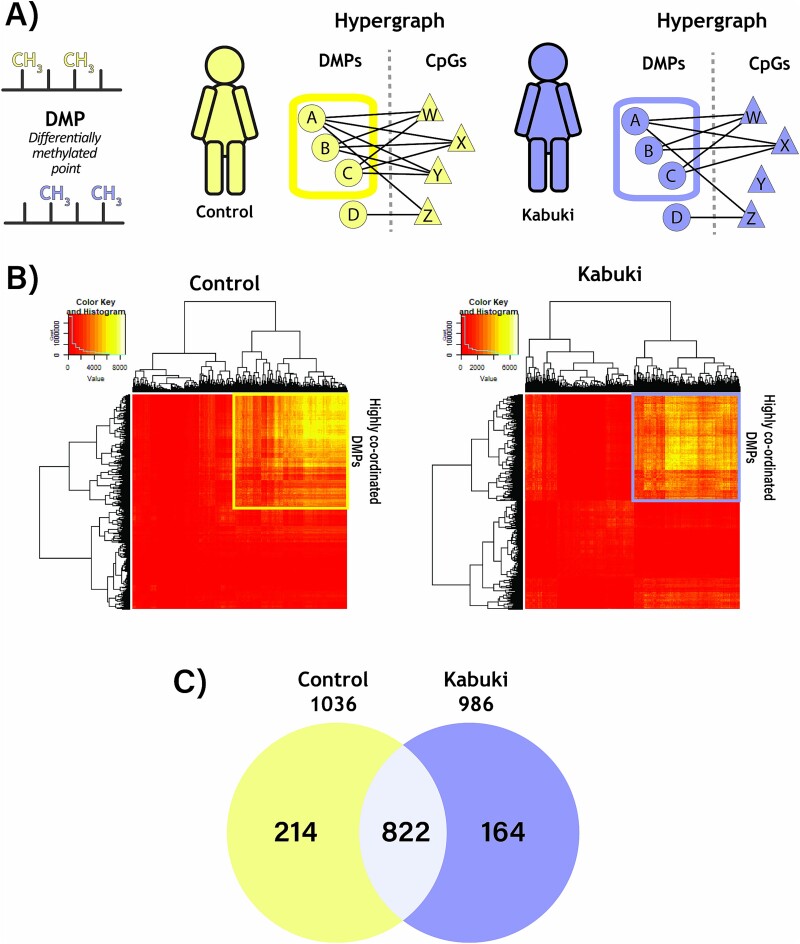
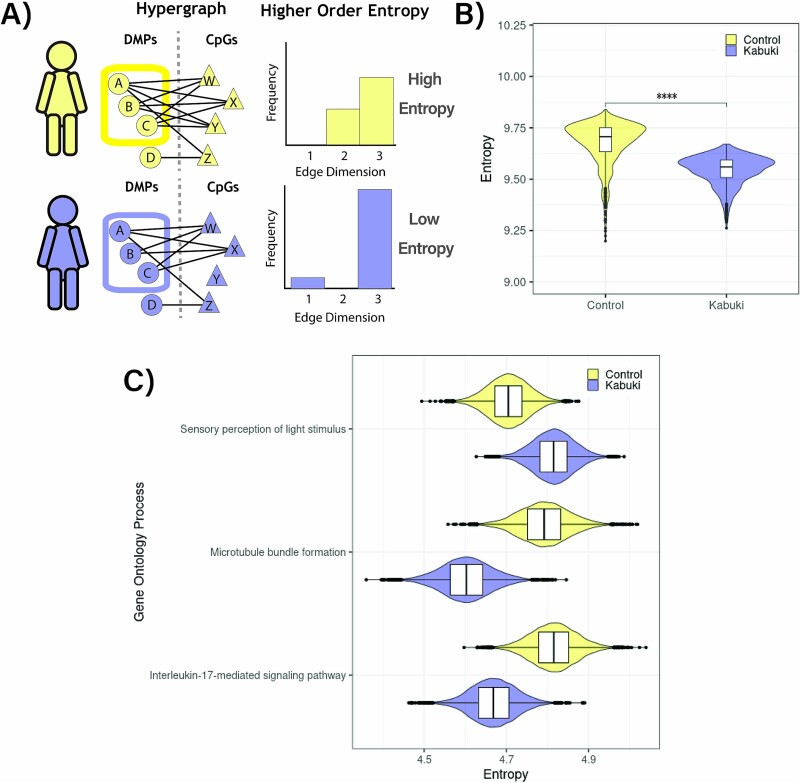
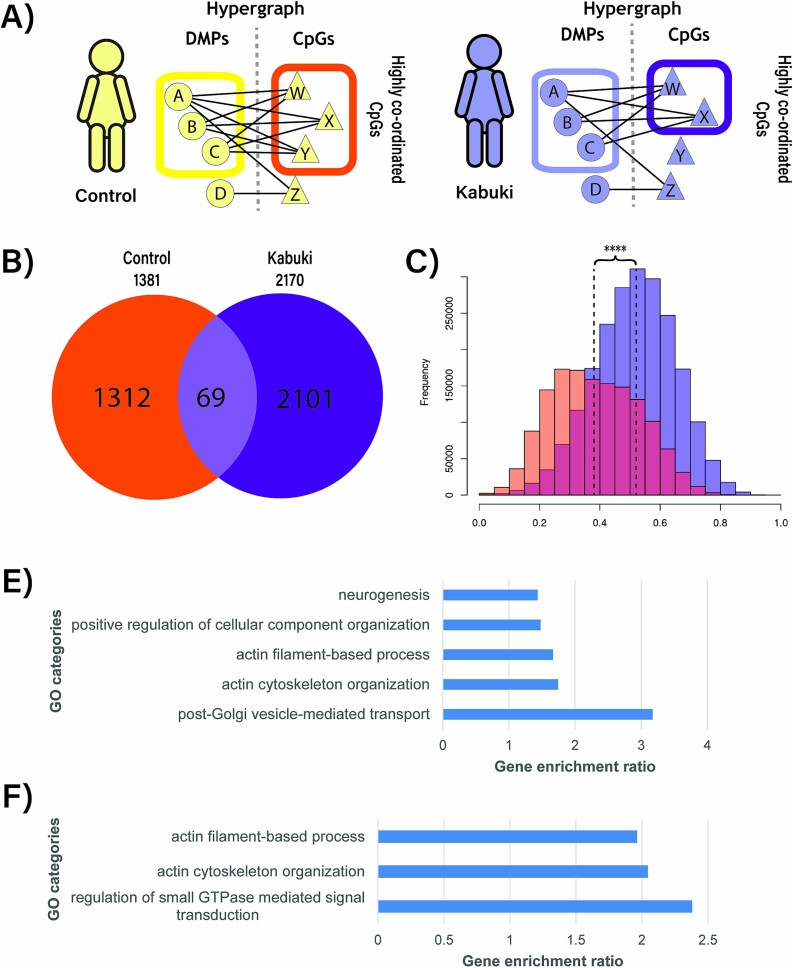
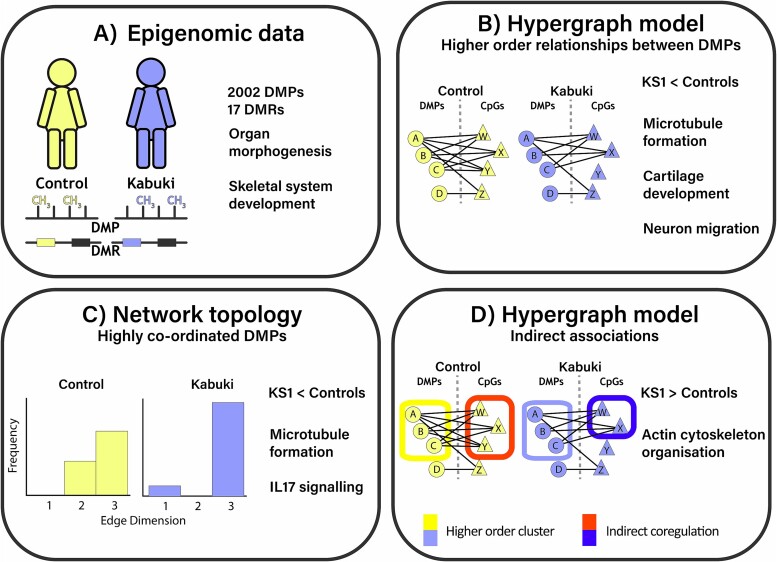
Complex direct and indirect relationships between multiple variables, termed higher order interactions (HOIs), are characteristics of all natural systems. Traditional differential and network analyses fail to account for the omic datasets richness and miss HOIs. We investigated peripheral blood DNA methylation data from Kabuki syndrome type 1 (KS1) and control individuals, identified 2,002 differentially methylated points (DMPs), and inferred 17 differentially methylated regions, which represent only 189 DMPs. We applied hypergraph models to measure HOIs on all the CpGs and revealed differences in the coordination of DMPs with lower entropy and higher coordination of the peripheral epigenome in KS1 implying reduced network complexity. Hypergraphs also capture epigenomic trans-relationships, and identify biologically relevant pathways that escape the standard analyses. These findings construct the basis of a suitable model for the analysis of organization in the epigenome in rare diseases, which can be applied to investigate mechanism in big data.

Keywords: DNA methylation; KMT2D; Kabuki syndrome; integration analysis.


Figures

Figure 1
Figure 1
Experimental design to assess the coordination of peripheral blood DNA methylation associated with Kabuki syndrome. The core features of the experimental design used to assess differences in the coordination of the epigenome between KS1 and controls. A) Peripheral blood DNA methylation is used to identify differences in the epigenome between KS1 and controls. Differentially methylated points (DMPs) and regions (DMRs) are defined using a statistical approach. B) Pairwise associations are defined between DMPs (A-D) and all remaining CpGs (W-Z). These bipartite network models distinguish HOIs from pairwise associations in the epigenome. Associations with CpGs which are common between DMPs can be considered HOIs between DMPs, or hyperedges, described here by sets w-z. C) To measure coordination of these higher order networks, an indicator of function, Shannon entropy is calculated on the distribution of edge dimensions. D) Hypergraph models are generated from these bipartite structures and refine clusters of coordinated DMPs (green box) as well as implicating a wider set of CpGs as potentially indirectly co-regulated (red box).
Figure 2
Figure 2
Peripheral blood DNA methylation reveals differences between KS1 and controls. A) Differentially methylated points are identified between KS1 and control patients. Control samples are indicated in yellow, KS1 in blue. B) Principal component analysis (PCA) of the peripheral blood DNA methylome demonstrates variation between KS1 and control samples. Shapes are used to differentiate the studies from which data were drawn: circles represent samples from Butcher et al., squares represent Sobreira et al. and triangles Cuvertino et al. C) a heatmap of relative methylation of DMPs (FDR).
Figure 3
Figure 3
KS1 results in differences in methylated regions between KS1 and controls. A) Differentially methylated regions are identified between KS1 and control patients. Control samples are indicated in yellow, KS1 in blue. B) Ideograms show the 17 DMRs (FWER<0.05).
Figure 4
Figure 4
Clustering hypergraph adjacency matrices reveals HOIs between DMPs which distinguish KS1 and controls. A) Pairwise relationships between DMPs and CpGs can be summarized as HOIs between pairs of DMPs using a hypergraph approach. B) Heatmaps of hypergraph adjacency matrices for control (L) and KS1 (R). Red to yellow coloring in the heatmap represents increasing dimensionality of the hyperedges between pairs of DMPs. Hierarchical clustering of the hyperedges reveals a central cluster of highly coordinated DMPs in controls (yellow box) and KS1 (purple box) associated to one another by HOIs. C) Venn diagram demonstrating the overlap of DMPs in the central cluster of the hypergraphs.
Figure 5
Figure 5
Topology of control and KS1 hypergraphs highlight differences in coordination. A) Co-ordination of the central cluster of the hypergraph in control (yellow) and KS1 (purple) can be quantified using Shannon entropy. Edge dimension is the number of shared correlations between a pair of vertices in the hypergraph model; entropy quantifies network structure from the distribution of edge dimensionality, such that a highly uniform network would have low entropy. B) Shannon entropy of the hypergraph central cluster of control and KS1 methylome. Presented data are compared to data from 1,000 matched iterations. C) Difference in entropy for pathways identified as enriched in the central clusters of either the control or KS1 hypergraphs. Bayesian Markov chain Monte Carlo sampling was performed to enable comparison between control and KS1. Only significantly different pathways (those where the 89% credible interval of the difference does not contain 0) are presented.
Figure 6
Figure 6
Co-ordinated DMPs demonstrate potential indirect co-regulation of a wider set of CpGs. A) In addition to refining clusters of coordinated DMPs (yellow/purple box) the hypergraph approach also implicates a wider set of CpGs (orange/dark purple box) as potentially indirectly co-regulated with the coordinated DMPs (yellow/purple box). B) Venn diagram of the indirectly co-regulated CpGs to demonstrate overlap between control and KS1. C) Distribution of correlation values (|r|) between DMPs and indirectly regulated CpGs in control (orange) and KS1 (dark purple). D-E) Ontology of nearest gene to indirectly regulated CpGs which were unique to control (D) or KS1 (E) (WebGestalt, FDR).
Figure 7
Figure 7
Analysis of blood DNA methylation reveals single CpG and regional differences, as well as differences in the coordination of the epigenome between KS1 and control. A) Statistical analysis highlights differences between KS1 and control in methylation of genes associated with morphology. B) HOIs between DMPs reveal a cluster of coordinated DMPs, present in both KS1 and control, in genes associated with organ development. C) Quantification of the coordination of DMPs demonstrated a lower entropy and therefore more defined coordination between DMPs in KS1 than control. D) The coordinated DMPs were indirectly associated with a wider range of CpGs in KS1 than controls. Differences in coordinated DMPs and indirectly implicated CpGs were associated with development and cellular organization.

Similar articles

References

    1. Cleary B, Cong L, Cheung A. et al. . Efficient generation of transcriptomic profiles by random composite measurements. Cell 2017;171:1424–1436.e1418. 10.1016/j.cell.2017.10.023. - DOI - PMC - PubMed
    1. Barzel B, Barabási A-L. Network link prediction by global silencing of indirect correlations. Nat Biotechnol 2013;31:720–5. 10.1038/nbt.2601. - DOI - PMC - PubMed
    1. Hudson NJ, Dalrymple BP, Reverter A. Beyond differential expression: the quest for causal mutations and effector molecules. BMC Genomics 2012;13:356. 10.1186/1471-2164-13-356. - DOI - PMC - PubMed
    1. Battiston F, Cencetti G, Iacopini I. et al. . Networks beyond pairwise interactions: structure and dynamics. Phys Rep 2020;874:1–92. 10.1016/j.physrep.2020.05.004. - DOI
    1. Eble H, Joswig M, Lamberti L., Ludington WB. Master regulators of biological systems in higher dimensions. Proc Natl Acad Sci U S A 2023;120:e2300634120, e2300634120. 10.1073/pnas.2300634120. - DOI - PMC - PubMed

Supplementary concepts