

Bayesian unsupervised clustering identifies clinically relevant osteosarcoma subtypes
- PMID: 39701601
- PMCID: PMC11658815
- DOI: 10.1093/bib/bbae665
Bayesian unsupervised clustering identifies clinically relevant osteosarcoma subtypes
Abstract
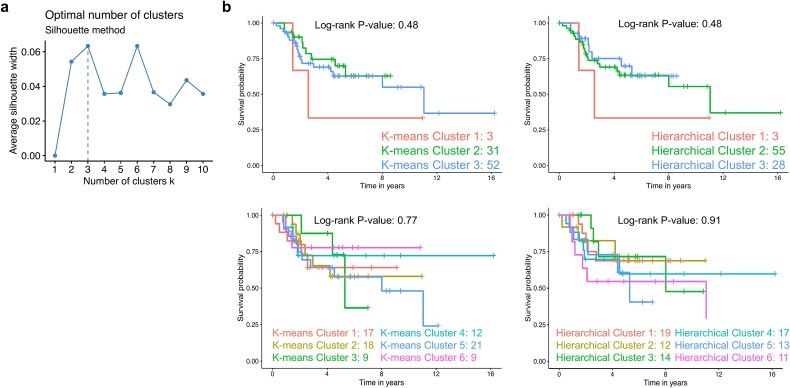
Identification of cancer subtypes is a critical step for developing precision medicine. Most cancer subtyping is based on the analysis of RNA sequencing (RNA-seq) data from patient cohorts using unsupervised machine learning methods such as hierarchical cluster analysis, but these computational approaches disregard the heterogeneous composition of individual cancer samples. Here, we used a more sophisticated unsupervised Bayesian model termed latent process decomposition (LPD), which handles individual cancer sample heterogeneity and deconvolutes the structure of transcriptome data to provide clinically relevant information. The work was performed on the pediatric tumor osteosarcoma, which is a prototypical model for a rare and heterogeneous cancer. The LPD model detected three osteosarcoma subtypes. The subtype with the poorest prognosis was validated using independent patient datasets. This new stratification framework will be important for more accurate diagnostic labeling, expediting precision medicine, and improving clinical trial success. Our results emphasize the importance of using more sophisticated machine learning approaches (and for teaching deep learning and artificial intelligence) for RNA-seq data analysis, which may assist drug targeting and clinical management.
Keywords: RNA-seq; heterogeneity; latent process decomposition; osteosarcoma; precision medicine.
© The Author(s) 2024. Published by Oxford University Press.
Figures


Similar articles
-
Molecular subtypes of osteosarcoma identified by reducing tumor heterogeneity through an interspecies comparative approach.Bone. 2011 Sep;49(3):356-67. doi: 10.1016/j.bone.2011.05.008. Epub 2011 May 15. Bone. 2011. PMID: 21621658 Free PMC article.
-
Cell Differentiation Trajectory-Associated Molecular Classification of Osteosarcoma.Genes (Basel). 2021 Oct 23;12(11):1685. doi: 10.3390/genes12111685. Genes (Basel). 2021. PMID: 34828292 Free PMC article.
-
An imprinted non-coding genomic cluster at 14q32 defines clinically relevant molecular subtypes in osteosarcoma across multiple independent datasets.J Hematol Oncol. 2017 May 15;10(1):107. doi: 10.1186/s13045-017-0465-4. J Hematol Oncol. 2017. PMID: 28506242 Free PMC article.
-
Molecular classification of osteosarcoma.Cancer Treat Res. 2009;152:459-65. doi: 10.1007/978-1-4419-0284-9_26. Cancer Treat Res. 2009. PMID: 20213408 Review.
-
Unsupervised machine learning methods and emerging applications in healthcare.Knee Surg Sports Traumatol Arthrosc. 2023 Feb;31(2):376-381. doi: 10.1007/s00167-022-07233-7. Epub 2022 Nov 15. Knee Surg Sports Traumatol Arthrosc. 2023. PMID: 36378293 Review.
Cited by
-
Post-treatment late and long-term effects in bone sarcoma: A scoping review.J Bone Oncol. 2025 Mar 21;52:100671. doi: 10.1016/j.jbo.2025.100671. eCollection 2025 Jun. J Bone Oncol. 2025. PMID: 40206491 Free PMC article. Review.
-
Correlation of multiple peripheral blood parameters with metastasis and invasion of papillary thyroid cancer: a retrospective cohort study.Endocrine. 2025 Jun;88(3):757-765. doi: 10.1007/s12020-025-04194-y. Epub 2025 Mar 1. Endocrine. 2025. PMID: 40025307 Free PMC article.
-
Exploratory Analysis of Molecular Subtypes in Early-Stage Osteosarcoma: Identifying Resistance and Optimizing Therapy.Cancers (Basel). 2025 May 16;17(10):1677. doi: 10.3390/cancers17101677. Cancers (Basel). 2025. PMID: 40427174 Free PMC article.
-
Targeting metastasis in paediatric bone sarcomas.Mol Cancer. 2025 May 29;24(1):153. doi: 10.1186/s12943-025-02365-z. Mol Cancer. 2025. PMID: 40442778 Free PMC article. Review.
References
MeSH terms
Grants and funding
LinkOut - more resources
Full Text Sources
