

GAADE: identification spatially variable genes based on adaptive graph attention network
- PMID: 39701602
- PMCID: PMC11658817
- DOI: 10.1093/bib/bbae669
GAADE: identification spatially variable genes based on adaptive graph attention network
Abstract
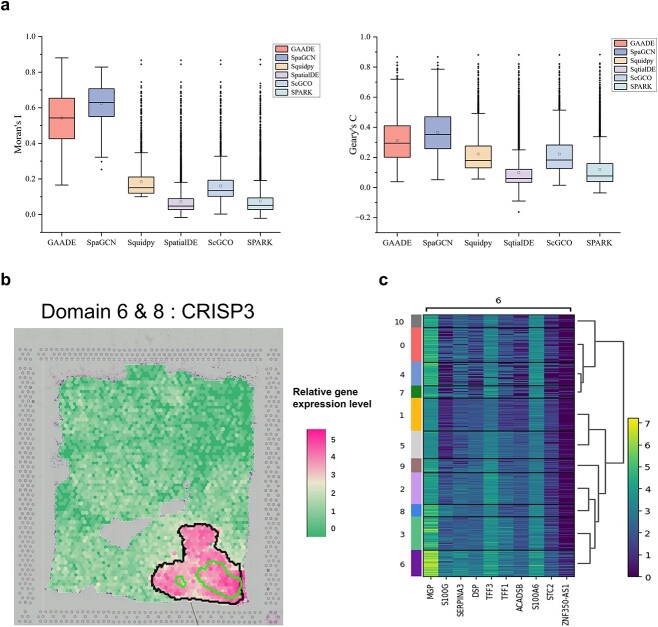
The rapid advancement of spatial transcriptomics (ST) sequencing technology has made it possible to capture gene expression with spatial coordinate information at the cellular level. Although many methods in ST data analysis can detect spatially variable genes (SVGs), these methods often fail to identify genes with explicit spatial expression patterns due to the lack of consideration for spatial domains. Considering spatial domains is crucial for identifying SVGs as it focuses the analysis of gene expression changes on biologically relevant regions, aiding in the more accurate identification of SVGs associated with specific cell types. Existing methods for identifying SVGs based on spatial domains predefine spot similarity before training, which prevents adaptive learning and limits generalizability across different tissues or samples. This limitation may also lead to inaccurate identification of specific genes at boundary regions. To address these issues, we present GAADE, an unsupervised neural network architecture based on graph-structured data representation learning. GAADE stacks encoder/decoder layers and integrates a self-attention mechanism to reconstruct node attributes and graph structure, effectively capturing spatial domain structures of different sections. Consequently, we confine the identification of SVGs within spatial domains. By performing differential expression analysis on spots within the target spatial domain and their multi-order neighbors, GAADE detects genes with enriched expression patterns within defined domains. Comparative evaluations with five other popular methods on ST datasets across four different species, regions and tissues demonstrate that GAADE exhibits superior performance in detecting SVGs and capturing the extent of spatial gene expression variation.
Keywords: ST-seq; graph attention auto-encoders; spatial domain; spatial neighbor graph; spatially variable gene.
© The Author(s) 2024. Published by Oxford University Press.
Figures


Similar articles
-
A multi-modality and multi-granularity collaborative learning framework for identifying spatial domains and spatially variable genes.Bioinformatics. 2024 Oct 1;40(10):btae607. doi: 10.1093/bioinformatics/btae607. Bioinformatics. 2024. PMID: 39418177 Free PMC article.
-
Identifying spatial domains of spatially resolved transcriptomics via multi-view graph convolutional networks.Brief Bioinform. 2023 Sep 20;24(5):bbad278. doi: 10.1093/bib/bbad278. Brief Bioinform. 2023. PMID: 37544658
-
stHGC: a self-supervised graph representation learning for spatial domain recognition with hybrid graph and spatial regularization.Brief Bioinform. 2024 Nov 22;26(1):bbae666. doi: 10.1093/bib/bbae666. Brief Bioinform. 2024. PMID: 39710435 Free PMC article.
-
A comprehensive review of approaches for spatial domain recognition of spatial transcriptomes.Brief Funct Genomics. 2024 Dec 6;23(6):702-712. doi: 10.1093/bfgp/elae040. Brief Funct Genomics. 2024. PMID: 39426802 Review.
-
Computational solutions for spatial transcriptomics.Comput Struct Biotechnol J. 2022 Sep 1;20:4870-4884. doi: 10.1016/j.csbj.2022.08.043. eCollection 2022. Comput Struct Biotechnol J. 2022. PMID: 36147664 Free PMC article. Review.
References
MeSH terms
Grants and funding
LinkOut - more resources
Full Text Sources
