. 2024 Dec 19;30(1):246.
doi: 10.1186/s10020-024-01017-0.

Depressed TFAM promotes acetaminophen-induced hepatotoxicity regulated by DDX3X-PGC1α-NRF2 signaling pathway

Affiliations

Depressed TFAM promotes acetaminophen-induced hepatotoxicity regulated by DDX3X-PGC1α-NRF2 signaling pathway

Sisi Chen et al. Mol Med. .

Abstract

Background: Acetaminophen (APAP)-induced acute liver injury (AILI) is the most prevalent cause of acute liver failure and mitochondrial dysfunction plays a dominant role in the pathogenesis of AILI. Mitochondrial transcription factor A (TFAM) is an important marker for maintaining mitochondrial functional homeostasis, but its functions in AILI are unclear. This study aimed to investigate the function of TFAM and its regulatory molecular mechanism in the progression of AILI.

Methods: The roles of TFAM and DEAD (Asp-Glu-Ala-Asp) box polypeptide 3 X-linked (DDX3X) in AILI were determined with TFAM overexpression and DDX3X knockdown, respectively.

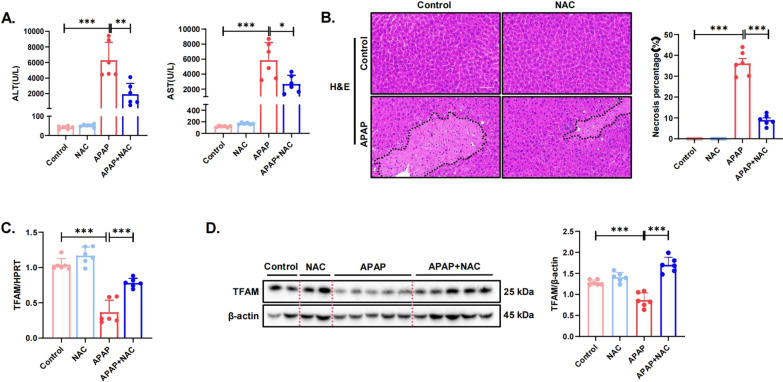
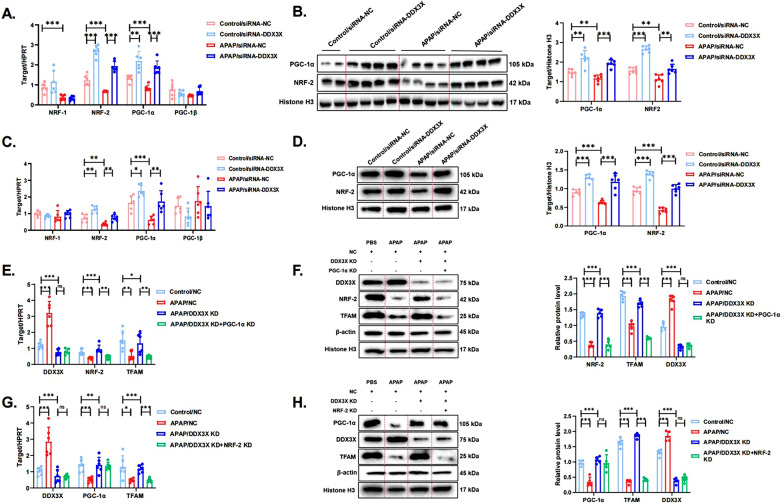
Results: TFAM expression was suppressed in AILI patients. TFAM overexpression alleviated liver necrosis and mitochondrial dysfunction. Treatment of the AILI mice model with N-acetylcysteine (NAC), a drug used to treat APAP overdose, resulted in significant TFAM activation. In vivo experiments confirmed that TFAM expression was negatively regulated by DDX3X. Mechanistic studies showed that nuclear respiratory factor 2 (NRF-2), a key regulator of TFAM, was selectively activated after DDX3X knockdown via activated peroxisome proliferator-activated receptor γ coactivator 1 (PGC-1α), in vivo and in vitro.

Conclusions: This study demonstrates that depressed hepatic TFAM plays a key role in the pathogenesis of AILI, which is regulated by the DDX3X-PGC1α-NRF2 signaling pathway.

Keywords: Acetaminophen; Acute liver injury; Mitochondrial transcription factor A; Peroxisome proliferator-activated receptor γ-coactivator-1α; Respiratory factor 2.


Conflict of interest statement

Declarations. Ethics approval and consent to participate: The content covered in this study was approved by the Ethics Committee in accordance with the requirements of local laws and regulations. All patients provided written informed consent before inclusion in the study. Consent for publication: Not applicable. Competing interests: The authors declare no competing interests.

Figures

Fig. 1
Fig. 1
Changes in the expression of mtDNA and TFAM in the liver tissues and serum of AILI patients. A Serum levels of mtDNA in normal subjects and in AILI patients. B Changes in the serum mtDNA levels of nine AILI patients, including four who died and five who survived. C The correlation between serum mtDNA levels and liver injury in AILI subjects was assessed by Pearson correlation analysis, including serum ALT levels, AST levels, ALB levels and Tbil levels. D Diagnostic value potential of mtDNA for AILI. E The gene expression of TFAM in normal subjects and AILI patients was measured by quantitative real-time PCR. F The protein levels of TFAM in human liver tissue samples were detected by western blotting and quantitated with the ImageJ software. G TFAM staining of liver tissue samples (green: TFAM-positive cells; blue: DAPI; scale bar, 10 µm). H Serum levels of TFAM in normal subjects and in AILI patients. *p < 0.05; **p < 0.01; ***p < 0.001; ****p < 0.0001; ns not significant
Fig. 2
Fig. 2
Expression profile of TFAM in APAP-induced mouse hepatotoxicity. A Serum AST and ALT enzyme levels. N = 6 for each group. B The gene expression of TFAM in mouse liver tissue samples was measured by quantitative real-time PCR. C The protein levels of TFAM in mouse liver tissue samples were detected by western blotting and quantitated with the ImageJ software. The blots and images are representative of three independent experiments. D Protein levels of TFAM in primary hepatocyte samples were detected by western blotting. The blots and images are representative of three independent experiments. E The gene expression of TFAM in primary hepatocytes was measured by quantitative real-time PCR. The protein levels of TFAM in primary hepatocyte samples were quantitated with the Image J software. Data from 3 independent experiments are shown as mean ± SD. F TFAM staining of primary hepatocyte samples (green: TFAM-positive cells; blue: DAPI; scale bar, 10 µm). G The quantitative immunofluorescence plots were measured with ImageJ software. Data from 3 independent experiments are shown as mean ± SD. *p < 0.05; **p < 0.01; ***p < 0.001; ****p < 0.0001; ns not significant
Fig. 3
Fig. 3
TFAM overexpression alleviates APAP-induced liver injury in mice. A Schematic representation of mouse model establishment and lentivirus injection. N = 4 for each group. N = 6 for each group. B Serum AST and ALT enzyme levels. C Hepatic mRNA and protein expression of TFAM and CYP2E1 in the different groups. D Representative images of H&E-stained liver sections. The areas surrounded by a black line and arrow are areas of liver tissue damage (magnification: 200×). Data represent the mean ratio of the necrotic area to the total area ± SD. E Protein levels of TFAM and CYP2E1 in mouse liver tissue samples were detected by western blotting and quantitated with the ImageJ software. The blots and images are representative of three independent experiments. F Serum levels of mtDNA in the different groups. G GSH levels in liver tissues in the different groups. *p < 0.05; **p < 0.01; ***p < 0.001; ****p < 0.0001; ns not significant
Fig. 4
Fig. 4
N-Acetylcysteine (NAC) treatment alleviates APAP-induced hepatotoxicity by upregulating TFAM expression. A Serum AST and ALT enzyme levels. N = 6 for each group. B Representative images of H&E-stained liver sections. The areas surrounded by a black line and arrow are areas of liver tissue damage (magnification: 200×). Data represent the mean ratio of the necrotic area to the total area ± SD. C The gene expression of TFAM in mouse liver tissue samples was measured by quantitative real-time PCR. D The protein levels of TFAM in mouse liver tissue samples were detected by western blotting and quantitated with the ImageJ software. The blots and images are representative of three independent experiments. *p < 0.05, ** p < 0.01, *** p < 0.001
Fig. 5
Fig. 5
DDX3X promotes APAP-induced liver injury by negatively regulating TFAM in vivo. A The hepatic mRNA and protein expression of DDX3X in mouse liver tissue samples (N = 6). The blots and images are representative of three independent experiments. B Detection of the effect of DDX3X knockdown on serum ALT and AST in the control or APAP model group. C Representative images of H&E-stained liver sections. The areas surrounded by a black line and arrow are areas of liver tissue damage (magnification: 200×). Data represent the mean ratio of the necrotic area to the total area ± SD. D The gene expression of TFAM was measured by quantitative real-time PCR in mouse liver tissue from AILI mice with DDX3X knockdown. The protein levels of TFAM in mouse liver tissue samples of AILI mice with DDX3X knockdown were detected by western blotting and quantitated with the ImageJ software. The blots and images are representative of three independent experiments. E Schematic representation of mouse model establishment and virus injection. N = 6 for each group. F DDX3X was knocked down, followed by TFAM in the AILI model, and serum ALT and AST levels in the model group and the single-knockdown and double-knockdown intervention groups were measured. Data represent the mean ratio of the necrotic area to the total area ± SD. *p < 0.05, **p < 0.01, *** p < 0.001, **** p < 0.0001
Fig. 6
Fig. 6
DDX3X promotes APAP-induced liver injury by inhibiting the PGC1α-NRF2-TFAM signaling pathway. A The gene expression of major signaling molecules associated with mitochondrial biogenesis in liver tissues of AILI mice with DDX3X knockdown were examined using quantitative real-time PCR. N = 6 for each group. The blots and images are representative of three independent experiments. B The nuclear protein levels of PGC-1α and NRF-2 in the liver tissue samples of AILI mice with DDX3X knockdown were detected by western blotting and quantitated with the ImageJ software. C The gene expression of major signaling molecules associated with mitochondrial biogenesis in APAP-stimulated cells with DDX3X knockdown was examined using quantitative real-time PCR. D The nuclear protein levels of PGC-1α and NRF-2 in APAP-stimulated cells with DDX3X knockdown were detected by western blotting and quantitated with the ImageJ software. Data from 3 independent experiments are shown as mean ± SD. E Single DDX3X knockdown or double knockdown of DDX3X and PGC-1α in the AILI cell model was performed, and the gene expression of DDX3X, NRF-2 and TFAM in the different subgroups was measured. F The protein levels of DDX3X, NRF-2 and TFAM in cells with single DDX3X knockdown or double knockdown of DDX3X and PGC-1α were detected by western blotting and quantitated with the ImageJ software. Data from three independent experiments are shown as mean ± SD. G Single DDX3X knockdown or double knockdown of DDX3X and NRF-2 in the AILI cell model was performed, and the gene expression of DDX3X, PGC-1α and TFAM in the different subgroups was measured. H The protein levels of DDX3X, PGC-1α and TFAM in cells with single DDX3X knockdown or double knockdown of DDX3X and NRF-2 were detected by western blotting and quantitated with the ImageJ software. Data from three independent experiments are shown as mean ± SD. *p < 0.05, **p < 0.01, *** p < 0.001, **** p < 0.0001; ns not significant

Similar articles

References

    1. Al-Hussaini A, Faqeih E, El-Hattab AW, Alfadhel M, Asery A, Alsaleem B, Bakhsh E, Ali A, Alasmari A, Lone K, et al. Clinical and molecular characteristics of mitochondrial DNA depletion syndrome associated with neonatal cholestasis and liver failure. J Pediatr. 2014;164(3):553-9.e92. - PubMed
    1. An P, Wei LL, Zhao S, Sverdlov DY, Vaid KA, Miyamoto M, Kuramitsu K, Lai M, Popov YV. Hepatocyte mitochondria-derived danger signals directly activate hepatic stellate cells and drive progression of liver fibrosis. Nat Commun. 2020;11(1):2362. - PMC - PubMed
    1. Barshad G, Marom S, Cohen T, Mishmar D. Mitochondrial DNA transcription and its regulation: an evolutionary perspective. Trends Genet. 2018;34(9):682–92. - PubMed
    1. Bashir S, Morgan WA. Inhibition of mitochondrial function: an alternative explanation for the antipyretic and hypothermic actions of acetaminophen. Life Sci. 2023;312: 121194. - PubMed
    1. Bunchorntavakul C, Reddy KR. Acetaminophen (APAP or N-Acetyl-p-aminophenol) and acute liver failure. Clin Liver Dis. 2018;22(2):325–46. - PubMed

MeSH terms

LinkOut - more resources