. 2024 Dec 19;24(1):1204.
doi: 10.1186/s12870-024-05913-9.

The GRAS gene family and its roles in pineapple (Ananas comosus L.) developmental regulation and cold tolerance

Affiliations

The GRAS gene family and its roles in pineapple (Ananas comosus L.) developmental regulation and cold tolerance

Jinting Lin et al. BMC Plant Biol. .

Abstract

Background: Pineapple (Ananas comosus L.) is a major tropical fruit crop with considerable economic importance, and its growth and development are significantly impacted by low temperatures. The plant-specific GRAS gene family plays crucial roles in diverse processes, including flower and fruit development, as well as in stress responses. However, the role of the GRAS family in pineapple has not yet been systematically analyzed.

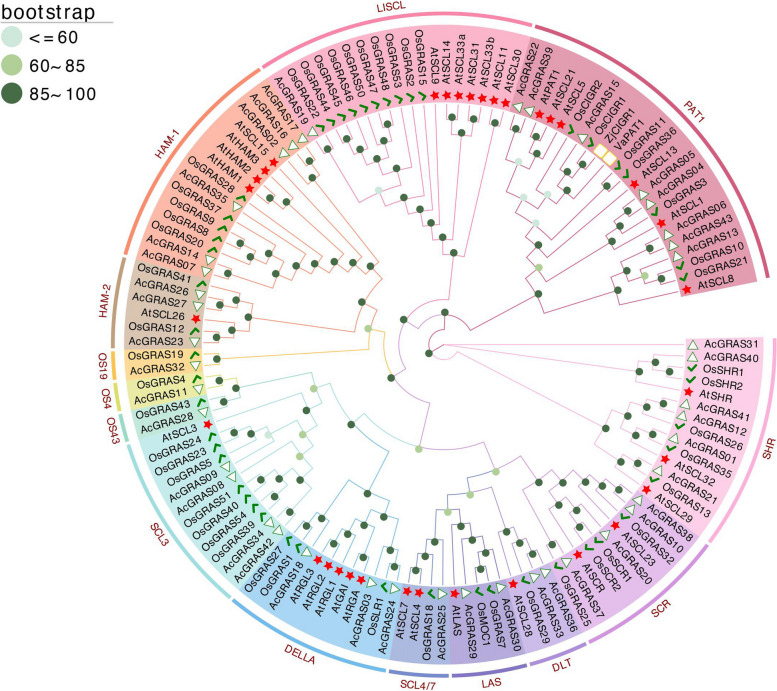
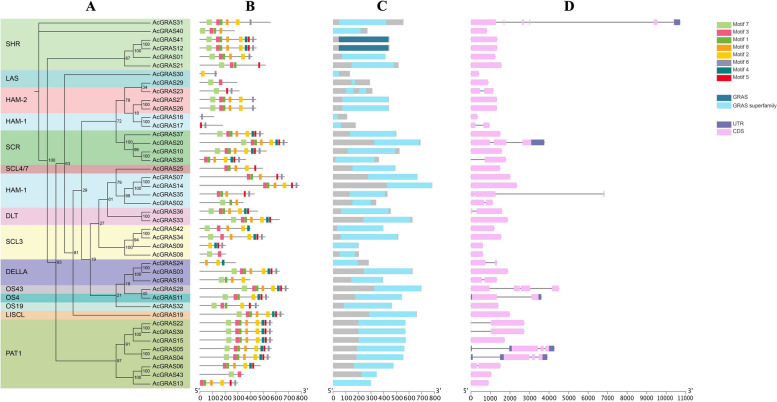
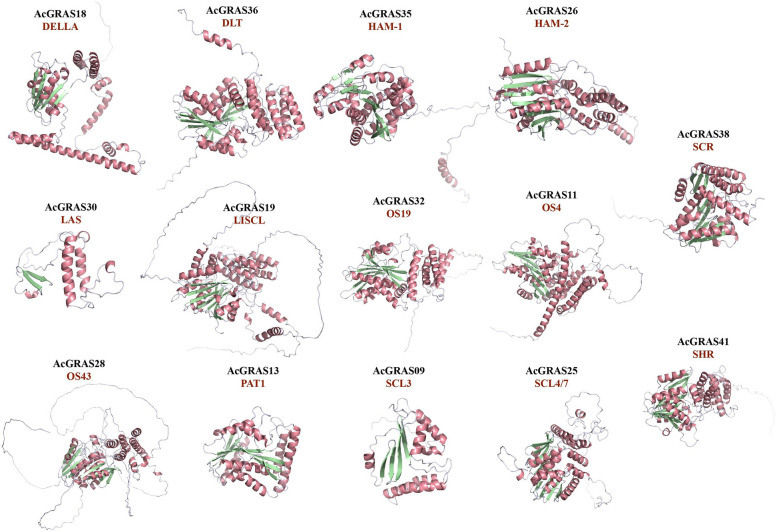
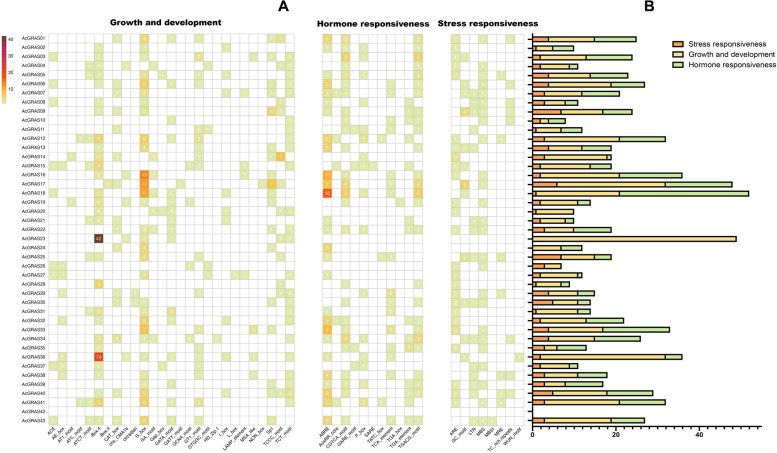
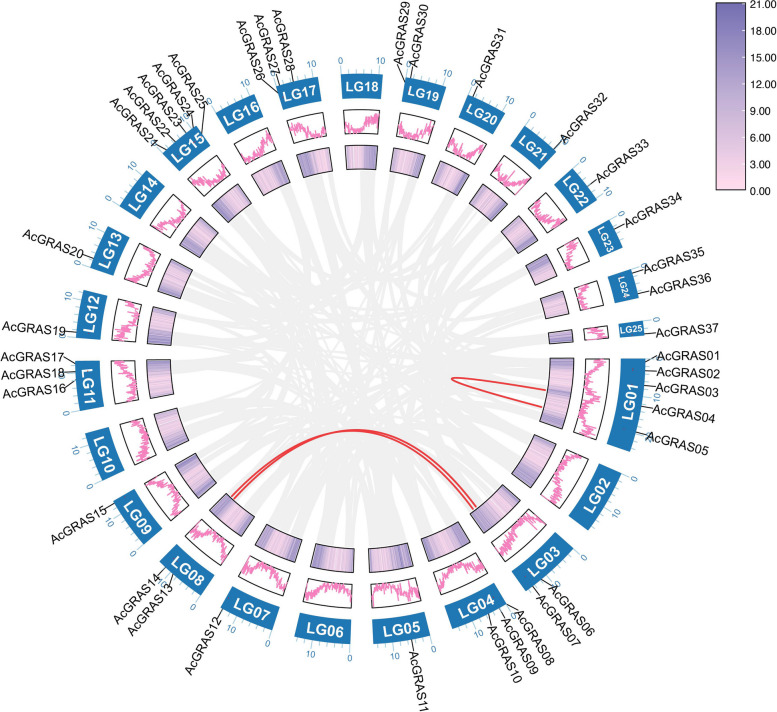
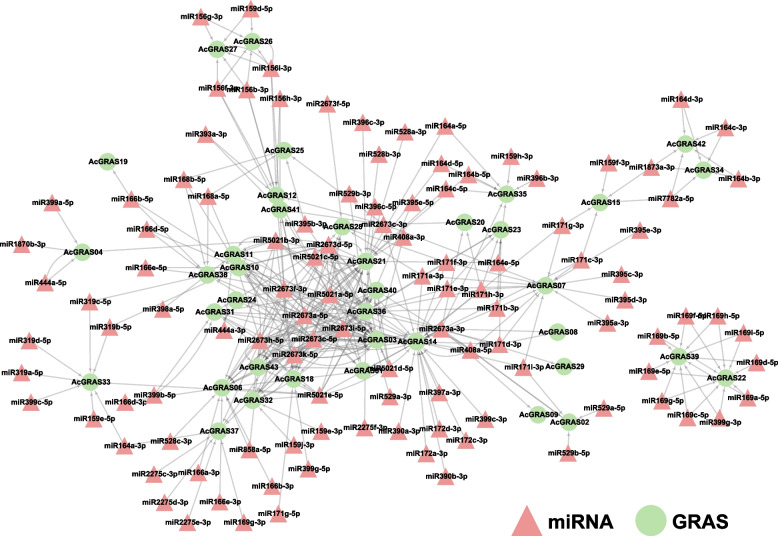
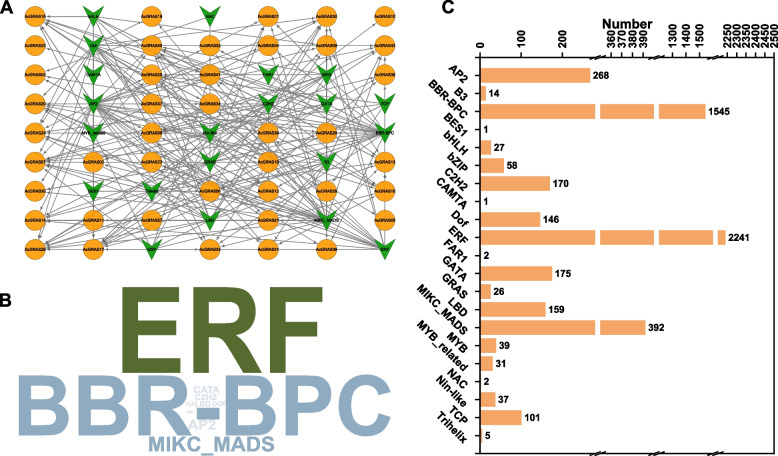
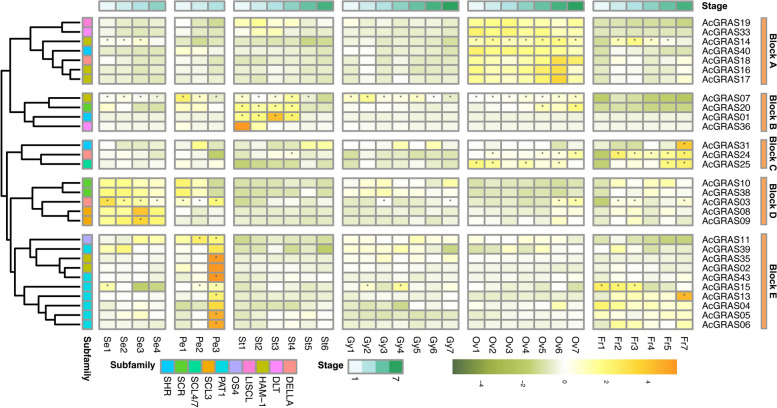
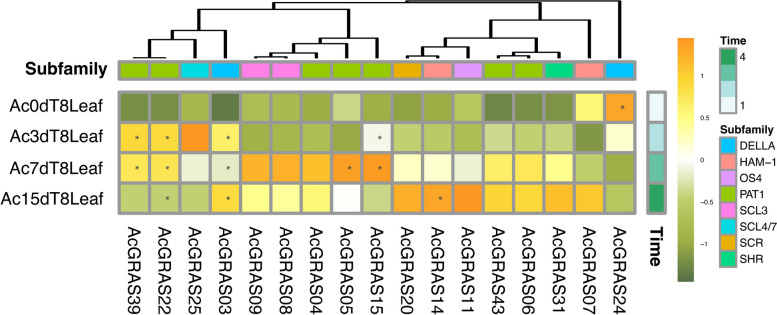
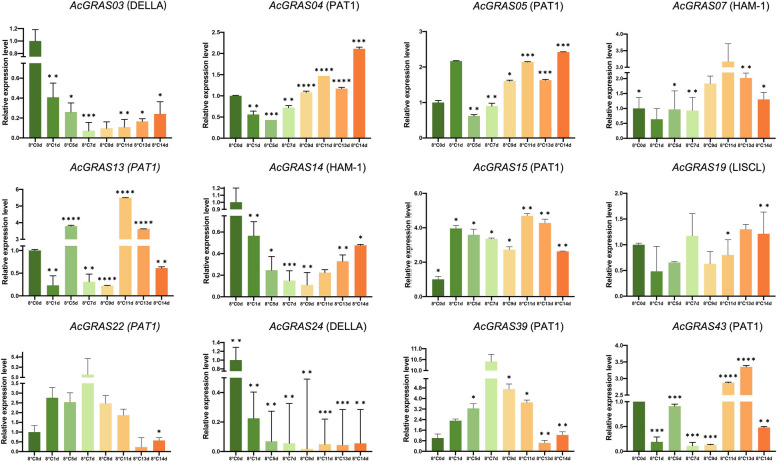
Results: In this study, 43 AcGRAS genes were identified in the pineapple genome; these genes were distributed unevenly across 19 chromosomes and 6 scaffolds and were designated as AcGRAS01 to AcGRAS43 based on their chromosomal locations. Phylogenetic analysis classified these genes into 14 subfamilies: OS19, HAM-1, HAM-2, SCL4/7, LISCL, SHR, PAT1, DLT, LAS, SCR, SCL3, OS43, OS4, and DELLA. Gene structure analysis revealed that 60.5% of the AcGRAS genes lacked introns. Expression profiling demonstrated tissue-specific expression, with most AcGRAS genes predominantly expressed in specific floral organs, fruit tissues, or during particular developmental stages, suggesting functional diversity in pineapple development. Furthermore, the majority of AcGRAS genes were induced by cold stress, but different members seemed to play distinct roles in short-term or long-term cold adaptation in pineapple. Notably, most members of the PAT1 subfamily were preferentially expressed during late petal development and were upregulated under cold stress, suggesting their special roles in petal development and the cold response. In contrast, no consistent expression patterns were observed among genes in other subfamilies, suggesting that various regulatory factors, such as miRNAs, transcription factors, and cis-regulatory elements, may contribute to the diverse functions of AcGRAS members, even within the same subfamily.

Conclusions: This study provides the first comprehensive analysis of GRAS genes in pineapple, offers valuable insights for further functional investigations of AcGRASs and provides clues for improving pineapple cold resistance breeding.

Keywords: GRAS transcription factor; Gene expression; Genome-wide analysis; Pineapple.


Conflict of interest statement

Declarations. Ethics approval and consent to participate: The experimental research and method on pineapple species comply with relevant institutional, national, and international guidelines. Consent for publication: Not applicable. Competing interests: The authors declare no competing interests.

Figures

Fig. 1
Fig. 1
Unrooted maximum-likelihood phylogenetic tree of GRAS proteins from Ananas comosus (Ac), Arabidopsis thaliana (At), and Oryza sativa (Os). The green triangle, green hook, and red star indicate the GRAS members from pineapple, rice, and Arabidopsis, respectively. The yellow-white squares represent the protein encoded by ZjCIGR1 from Zoysia japonica [27] and the gene VaPAT1 from Vitis vinifera [26]
Fig. 2
Fig. 2
Phylogenetic relationships, motif compositions, conserved domains and gene structures of AcGRASs. A Maximum likelihood phylogenetic tree of AcGRAS proteins; B Conserved motif distribution of AcGRAS proteins. A total of eight motifs were predicted, the scale bar indicated 100 aa, and the logo and sequence of the conserved motifs were provided in Additional file 4: Table S4. C Conserved domain distribution of AcGRAS proteins; D Gene structure of AcGRAS genes, including introns (black line), exons (pink rectangle) and untranslated regions (UTRs, purple rectangles). The scale bar represented 1 kb
Fig. 3
Fig. 3
Predicted 3D structural modeling of AcGRAS proteins. The structure with the highest GMQE and QMEAN scores in each subfamily was selected as the representative model
Fig. 4
Fig. 4
Cis-regulatory elements in the putative promoter regions of the AcGRAS genes. A Heatmap of the number of cis-regulatory elements, the different color presented the number of cis-elements. B The sum of cis-regulatory elements in each category is shown in the histogram
Fig. 5
Fig. 5
Distribution and collinearity of AcGRAS genes in the pineapple genome. The background gray lines represent all the syntenic blocks in the pineapple genome, and the red lines represent duplicate AcGRAS gene pairs. Chromosome numbers are shown at the bottom of each chromosome. The two rings in the middle represent the gene density of each chromosome
Fig. 6
Fig. 6
Synteny analysis of AcGRAS genes and four representative plant species. Grey lines in the background indicate collinear blocks in pineapple and other plant genomes, whereas the colored lines highlight syntenic GRAS gene pairs. Species names are prefixed with ‘A. thaliana’, ‘O. sativa’, ‘V.vinifera’ and ‘M.nana’, denote Arabidopsis thaliana, Oryza sativa, Vitis vinifera and Musa nana, respectively
Fig. 7
Fig. 7
Predicted miRNAs targeting AcGRAS genes. The network diagram shows the predicted miRNA targets for AcGRAS genes. Red triangular nodes represent the predicted miRNAs, and green circular nodes represent the targeted AcGRAS genes
Fig. 8
Fig. 8
Putative TF regulatory network analysis of AcGRAS genes. A Network diagram illustration of the predicted TFs that target AcGRAS genes. Green arrow-shaped nodes represent TFs, and orange circular nodes represent AcGRAS genes. B Word cloud of TFs, where the font size is positively correlated with the number of corresponding TFs. C Statistical results of the number of TFs
Fig. 9
Fig. 9
Hierarchical clustering of the expression profiles of AcGRASs in floral tissues and fruits at different developmental stages. Se, sepal; Gy, gynoecium; Ov, ovule; Pe, petal; St, stamen; Fr, fruit; numbers represent developmental stages as described in Wang et al. (2020) [56]; the heatmap was created based on the log2(TPM + 0.01) value of AcGRASs and normalized by row. The TPM value higher than 50 was shown as abundant genes and marked with “*”. Differences in gene expression changes are shown in color as the scale, orange for high expression and dark green for low expression
Fig. 10
Fig. 10
Hierarchical clustering of the expression profiles of the AcGRASs under cold treatment at 8 °C (0 d, 3 d, 7 d, and 15 d). The heatmap was created based on the log2(TPM + 0.01) value of AcGRASs and normalized by row. The TPM value higher than 50 was shown as abundant genes and marked with “*”. Differences in gene expression changes are shown in color as the scale, orange for high expression and dark green for low expression
Fig. 11
Fig. 11
qRT-PCR analysis of 12 representative AcGRAS genes (AcGRAS03, AcGRAS14, AcGRAS07, AcGRAS24, AcGRAS19, AcGRAS39, AcGRAS22, AcGRAS15, AcGRAS13, AcGRAS05, AcGRAS43, and AcGRAS04) under cold (8 °C) stress in pineapple. All the experiments were conducted independently at least three times. Error bars indicate the standard deviation across three replicates. Asterisks denote significant differences in transcript levels relative to the blank control without treatment (0 d) (*P < 0.05, **P < 0.01, ***P < 0.001)

Similar articles

Cited by

References

    1. Neves C, Ribeiro B, Amaro R, Expósito J, Grimplet J, Fortes AM. Network of GRAS transcription factors in plant development, fruit ripening and stress responses. Hortic Res. 2023;10(12):uhad220. - PMC - PubMed
    1. Pysh LD, Wysocka-Diller JW, Camilleri C, Bouchez D, Benfey PN. The GRAS gene family in Arabidopsis: sequence characterization and basic expression analysis of the SCARECROW-LIKE genes. Plant J. 1999;18(1):111–9. - PubMed
    1. Gonzalez DH. Plant transcription factors: evolutionary, structural and functional aspects. London: Academic Press; 2015.
    1. Hirsch S, Oldroyd GE. GRAS-domain transcription factors that regulate plant development. Plant Signal Behav. 2009;4(8):698–700. - PMC - PubMed
    1. Liu X, Widmer A. Genome-wide comparative analysis of the GRAS gene family in Populus, Arabidopsis and rice. Plant Mol Biol Repo. 2014;32:1129–45.

LinkOut - more resources