

Single-cell transcriptomic and cell‑type‑specific regulatory networks in Polima temperature-sensitive cytoplasmic male sterility of Brassica napus L
- PMID: 39701979
- PMCID: PMC11656827
- DOI: 10.1186/s12870-024-05916-6
Single-cell transcriptomic and cell‑type‑specific regulatory networks in Polima temperature-sensitive cytoplasmic male sterility of Brassica napus L
Abstract
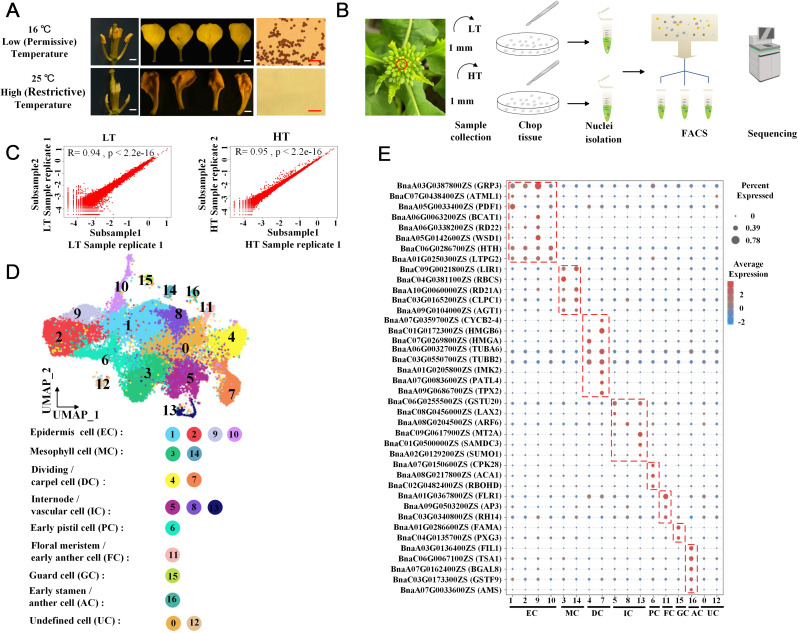
Background: Thermosensitive male sterility (TMS) is a heritable agronomic trait influenced by the interaction between genotype and environment. The anthers of plants are composed of various specialized cells, each of which plays different roles in plant reproduction. In rapeseed (Brassica napus L.), Polima (pol) temperature-sensitive cytoplasmic male sterility (TCMS) is widely used in two-line breeding because its fertility can be partially restored at certain temperatures. The pol-TCMS line exhibits abnormal anther development and pollen abortion at high (restrictive) temperatures (HT, 25 °C) compared to at low (permissive) temperatures (LT, 16 °C). However, the response of different anther cell types to HT and the dynamic regulation of genes under such conditions remain largely unknown.
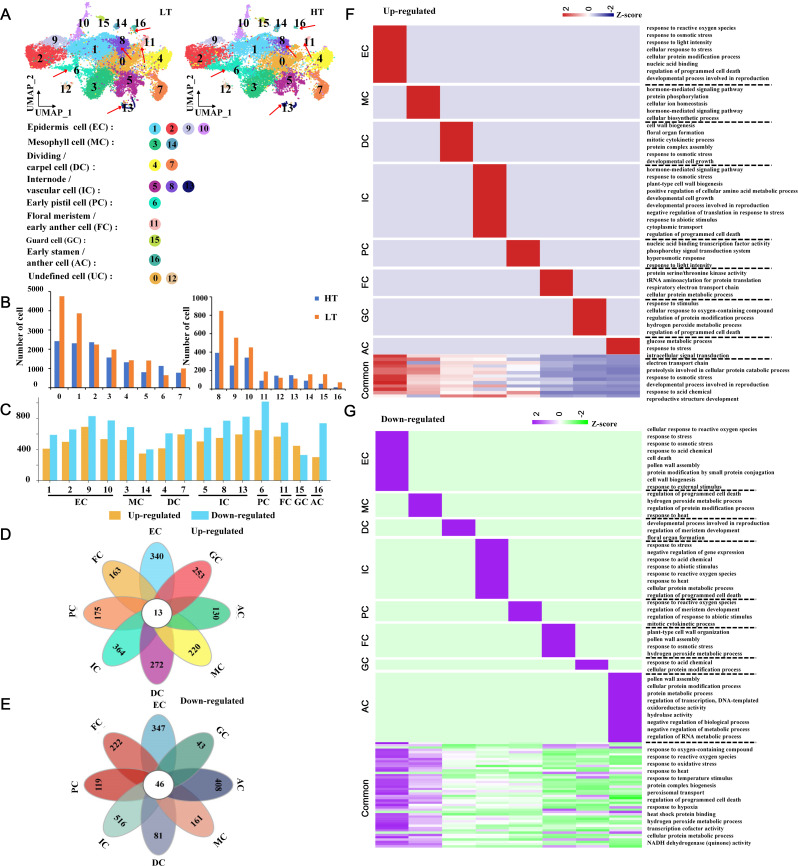
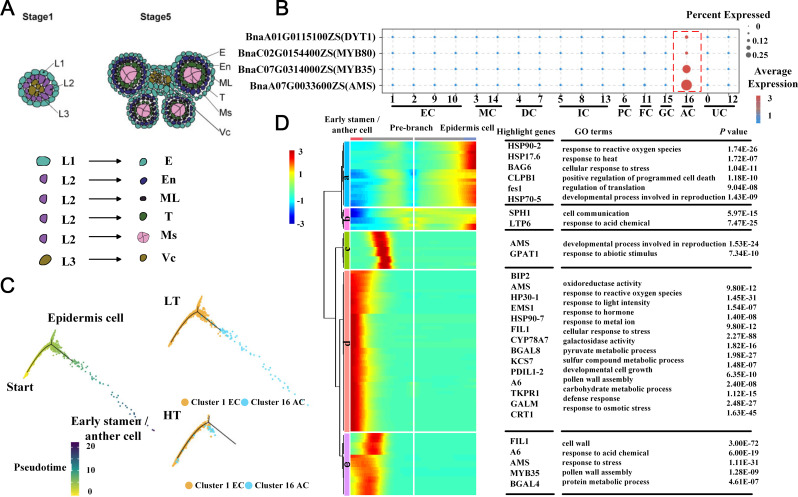
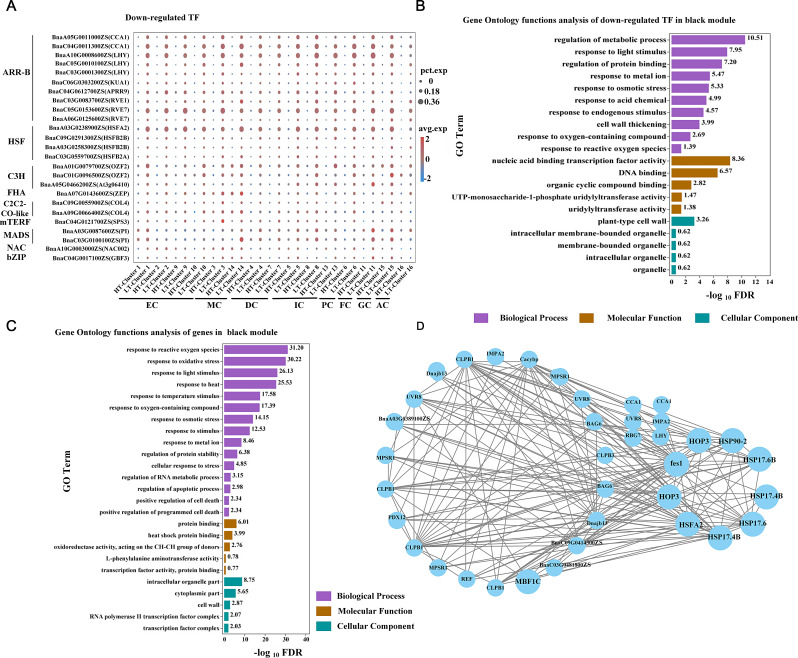
Results: We present the first single-cell transcriptomic atlas of Brassica napus early developing flower bud tissues in response to HT. We identified 8 cell types and 17 transcriptionally distinct cell clusters via known marker genes under LT and HT treatment conditions. Under HT conditions, changes in the gene expression patterns of different cell clusters were observed, with the number of down-regulated genes in various cell types exceeding that of up-regulated genes. Pseudotime trajectory analysis revealed that HT strongly affected the development of early stamen/anther tissue cells. In combination with the snRNA-seq, WGCNA, and bulk RNA-seq results, we found that many transcription factors play crucial roles in the response to HT, especially heat response family genes.
Conclusions: Our study revealed the transcriptional regulatory network of floral bud tissue in the pol-TCMS line under HT/LT conditions and increased our understanding of high-temperature-induced anther developmental abnormalities, which may help researchers utilize TCMS in the two-line breeding of Brassica plants.
Keywords: Brassica napus; Pol TCMS; Anther; Flower bud; SnRNA-seq; Stamen.
© 2024. The Author(s).
Conflict of interest statement
Declarations. Ethics approval and consent to participate: Not applicable. Consent for publication: Not applicable. Competing interests: The authors declare no competing interests.
Figures

Similar articles
-
Molecular Analysis Uncovers the Mechanism of Fertility Restoration in Temperature-Sensitive Polima Cytoplasmic Male-Sterile Brassica napus.Int J Mol Sci. 2021 Nov 18;22(22):12450. doi: 10.3390/ijms222212450. Int J Mol Sci. 2021. PMID: 34830333 Free PMC article.
-
Comparative transcript profiling of the fertile and sterile flower buds of pol CMS in B. napus.BMC Genomics. 2014 Apr 3;15:258. doi: 10.1186/1471-2164-15-258. BMC Genomics. 2014. PMID: 24707970 Free PMC article.
-
Cytological observation of anther structure and genetic investigation of a thermo-sensitive genic male sterile line 373S in Brassica napus L.BMC Plant Biol. 2020 Jan 6;20(1):8. doi: 10.1186/s12870-019-2220-1. BMC Plant Biol. 2020. PMID: 31906856 Free PMC article.
-
Global Dynamic Transcriptome Programming of Rapeseed (Brassica napus L.) Anther at Different Development Stages.PLoS One. 2016 May 3;11(5):e0154039. doi: 10.1371/journal.pone.0154039. eCollection 2016. PLoS One. 2016. PMID: 27139433 Free PMC article.
-
An overview of cytoplasmic male sterility in Brassica napus.Funct Plant Biol. 2025 May;52:FP24337. doi: 10.1071/FP24337. Funct Plant Biol. 2025. PMID: 40310995 Review.
Cited by
-
Single-cell omics in plant biology: mechanistic insights and applications for crop improvement.Adv Biotechnol (Singap). 2025 Jul 2;3(3):20. doi: 10.1007/s44307-025-00074-8. Adv Biotechnol (Singap). 2025. PMID: 40593253 Free PMC article. Review.
-
Opportunities and challenges in the application of single-cell transcriptomics in plant tissue research.Physiol Mol Biol Plants. 2025 Feb;31(2):199-209. doi: 10.1007/s12298-025-01558-6. Epub 2025 Feb 22. Physiol Mol Biol Plants. 2025. PMID: 40070535 Review.
References
MeSH terms
Grants and funding
LinkOut - more resources
Full Text Sources
