. 2024 Dec 20;25(1):1215.
doi: 10.1186/s12864-024-11110-7.

A constitutive heterochromatic region shapes genome organization and impacts gene expression in Neurospora crassa

Affiliations

A constitutive heterochromatic region shapes genome organization and impacts gene expression in Neurospora crassa

Andrew T Reckard et al. BMC Genomics. .

Abstract

Background: Organization of the eukaryotic genome is essential for proper function, including gene expression. In metazoans, chromatin loops and Topologically Associated Domains (TADs) organize genes into transcription factories, while chromosomes occupy nuclear territories in which silent heterochromatin is compartmentalized at the nuclear periphery and active euchromatin localizes to the nucleus center. A similar hierarchical organization occurs in the fungus Neurospora crassa where its seven chromosomes form a Rabl conformation typified by heterochromatic centromeres and telomeres independently clustering at the nuclear membrane, while interspersed heterochromatic loci aggregate across Megabases of linear genomic distance to loop chromatin in TAD-like structures. However, the role of individual heterochromatic loci in normal genome organization and function is unknown.

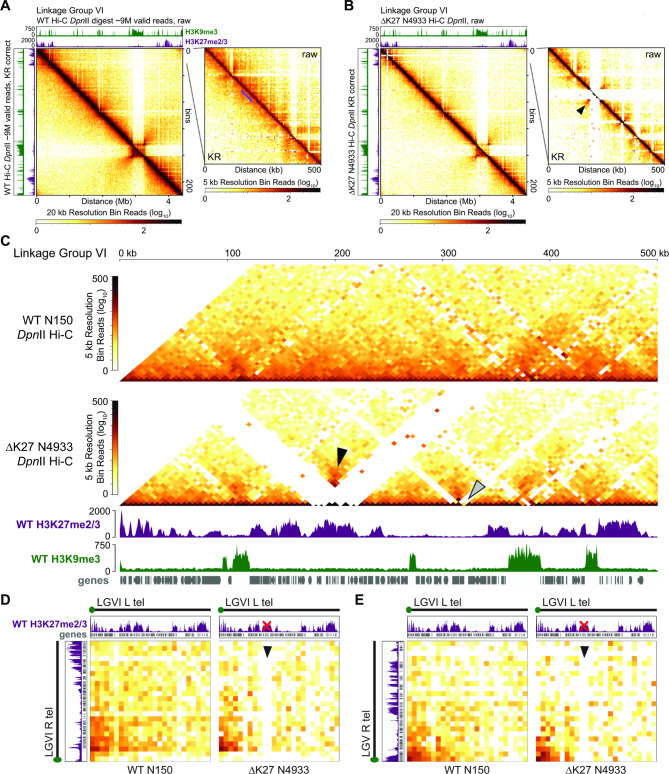
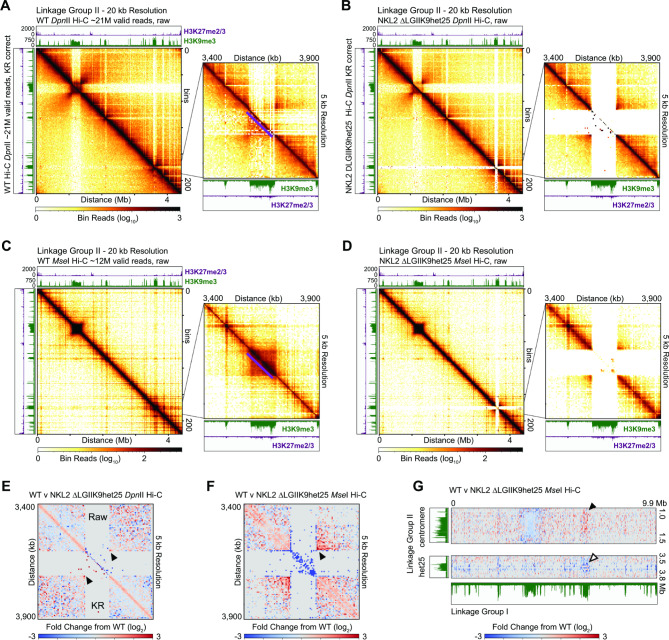
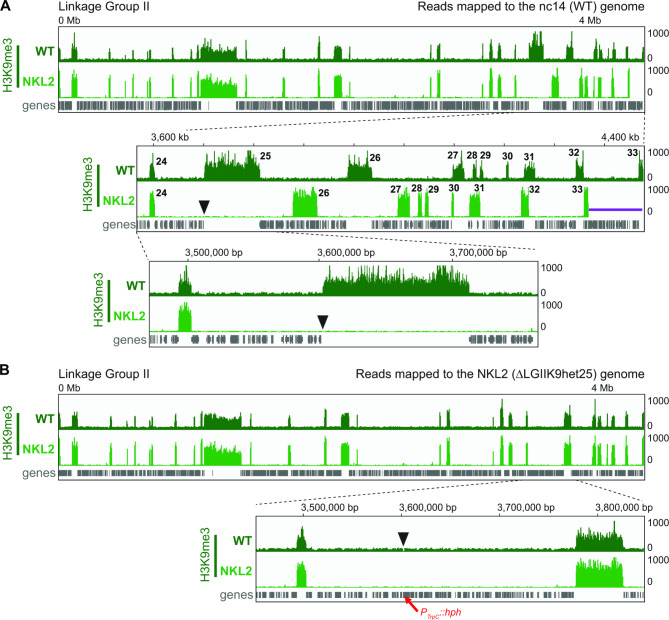
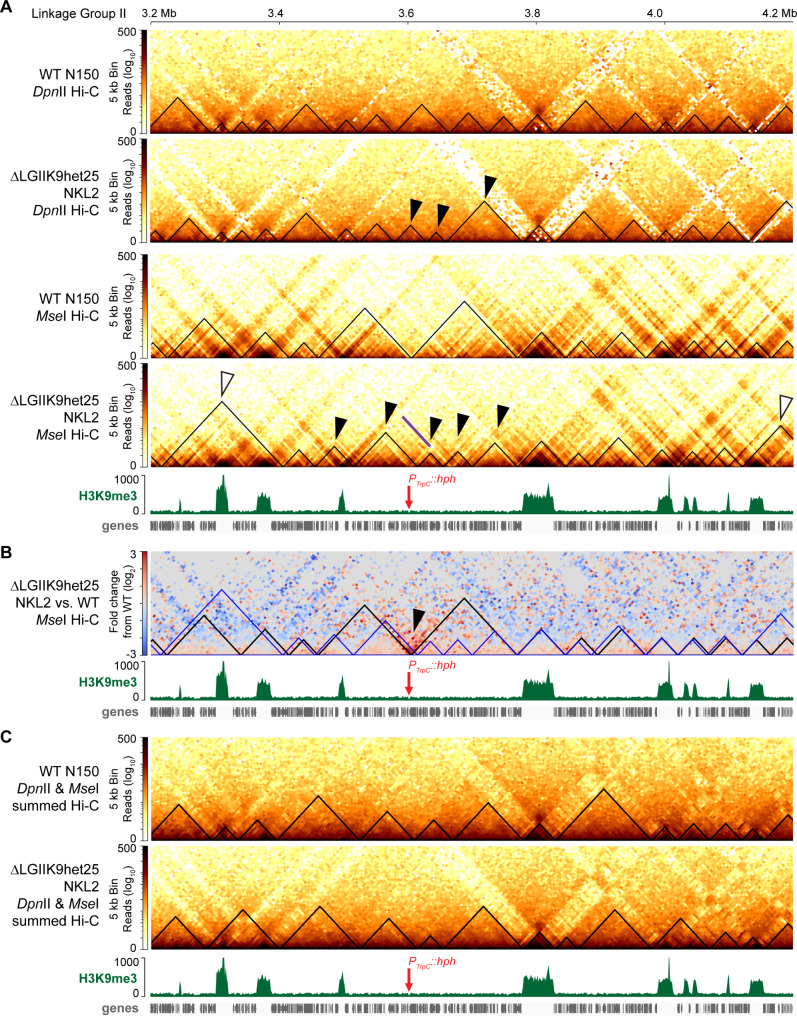
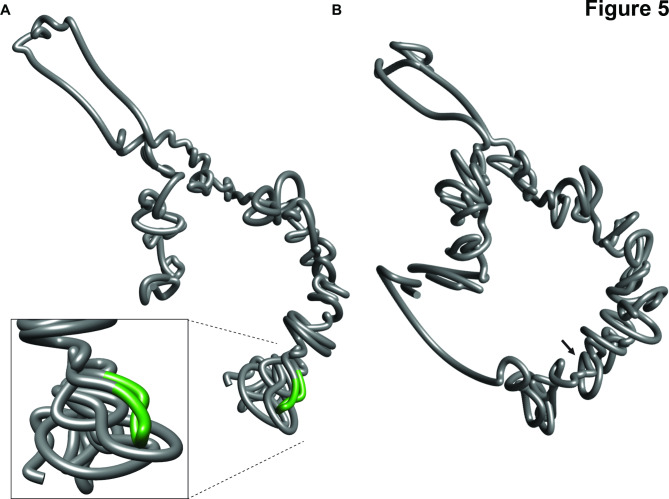
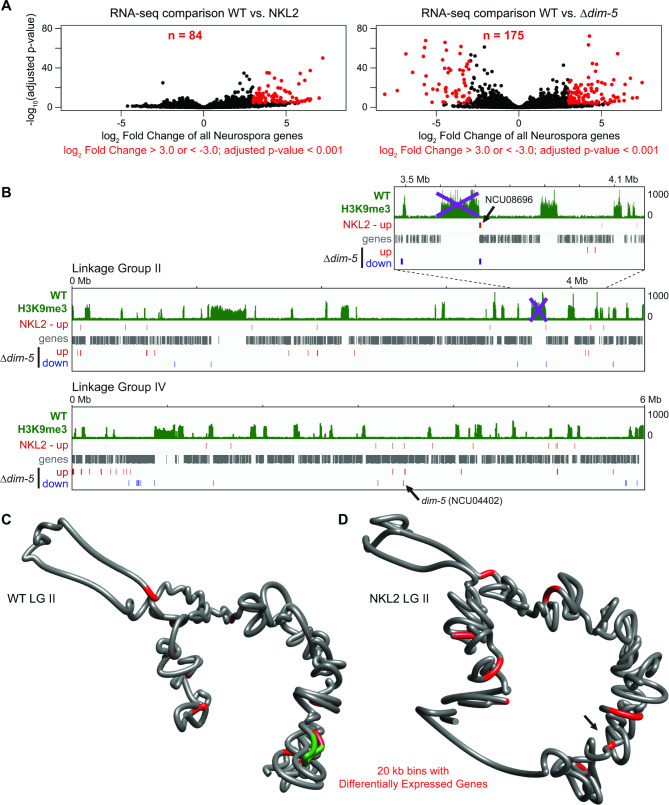
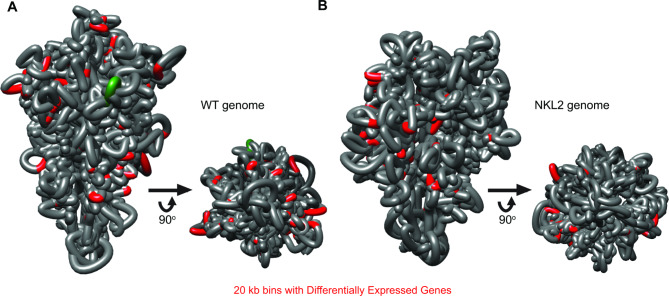
Results: We examined the genome organization of a Neurospora strain harboring a ~ 47.4 kilobase deletion within a temporarily silent, facultative heterochromatic region, as well as the genome organization of a strain deleted of a 110.6 kilobase permanently silent constitutive heterochromatic region. While the facultative heterochromatin deletion minimally effects local chromatin structure or telomere clustering, the constitutive heterochromatin deletion alters local chromatin structure, the predicted three-dimensional chromosome conformation, and the expression of some genes, which are qualitatively repositioned into the nucleus center, while increasing Hi-C variability.

Conclusions: Our work elucidates how an individual constitutive heterochromatic region impacts genome organization and function. Specifically, one silent region indirectly assists in the hierarchical folding of the entire Neurospora genome by aggregating into the "typical" heterochromatin bundle normally observed in wild type nuclei, which may promote normal gene expression by positioning euchromatin in the nucleus center.

Keywords: Neurospora crassa; Chromosome conformation; Gene expression; Genome organization; Heterochromatin.


Conflict of interest statement

Declarations. Ethics approval and consent to participate: Not applicable. Consent for publication: Not applicable. Competing interests: The authors declare no competing interests.

Figures

Fig. 1
Fig. 1
A strain harboring a 47.4 kilobase deletion of a H3K27me2/3-enriched domain has minimal genome organization change. (A-B) Contact probability heatmaps of DpnII (euchromatin-specific) in situ Hi-C datasets at 20 kb resolution across Linkage Group VI (LG VI) of the (A) WT or (B) N4933 strains, the latter deleted of a 47.4 kb H3K27me2/3-enriched region (“ΔK27”). Enhanced heatmaps show the terminal 500 kb of LG VI, harboring ΔK27, at 5 kb resolution. Each Hi-C image displays the raw contact probability heatmap above the diagonal and the Knight Ruiz (KR) [60] corrected contact probability heatmap below the diagonal; KR correction reduces inherent biases in contact probability matrices. Scalebars shown below the images. Images of wild type H3K9me3 (green) and H3K27me2/3 (purple) ChIP-seq tracks, displayed on IGV [50], above and to the right. The purple line in (A) shows the WT location of the H3K27me2/3-enriched region deleted in the ΔK27 strain, while the black arrowhead in (B) shows the increased contact probability of flanking euchromatin in ΔK27. (C) KR corrected contact probability heatmaps of the DpnII in situ Hi-C datasets of WT and ΔK27 strains primarily showing on-diagonal contacts at 5 kb bin resolution. Wild type H3K9me3 ChIP-seq (green), H3K27me2/3 ChIP-seq (purple), and gene (gray) tracks shown below. Scalebar to the left. The black arrowhead shows the increased contact probability of euchromatin flanking the ΔK27 deletion, while the gray arrowhead shows the contact probability loss at a putative transposable element (sly-1, gene NCU09969). (D-E) Contact probability heatmaps of the WT and ΔK27 telomere interactions, with the (D) intra-chromosomal (LG VI left and right telomeres) or (E) inter-chromosomal (LG VI left telomere and LG V right telomere) contacts shown. Telomere schematic (with the green circle showing the approximate position of the telomere repeats), and tracks of H3K27me2/3 ChIP-seq (purple) or genes (gray) shown above and right. The red “X” covers the deleted H3K27me2/3 domain, while the black arrowhead shows the deletion site contact depletion
Fig. 2
Fig. 2
A ~ 110 kb H3K9me3-enriched domain deletion alters constitutive heterochromatic region clustering. (A-D) Contact probability heatmaps, presented as in Fig. 1, of (A-B) DpnII (euchromatin-specific) and (C-D) MseI (heterochromatin specific) in situ Hi-C datasets at 20 kb resolution across LG II of (A, C) WT or (B, D) NKL2 strains, the latter deleted of the 25th H3K9me3-enriched region from the LG II left telomere (“ΔLGIIK9het25”). The purple line in A shows the deleted LGIIK9het25 region. Enhanced (5 kb) resolution heatmaps show the 500 kb surrounding the ΔLGIIK9het25 allele, as in Fig. 1A-B. (E-F) Images showing the log2 change in Hi-C contact probability between WT and ΔLGIIK9het25 strains in (E) DpnII (euchromatin-specific) or (F) MseI (heterochromatin-specific) 5 kb resolution datasets over the 500 kb surrounding the ΔLGIIK9het25 allele. The scalebar of contact probability changes is shown below. (G) Images showing the change in inter-chromosomal MseI Hi-C contact probability between LG I and the (top) LG II centromere or (bottom) LGIIK9het25 interspersed heterochromatic region
Fig. 3
Fig. 3
The LGIIK9het25 deletion does not compromise H3K9me3 deposition at other constitutive heterochromatic regions in the NKL2 strain. (A-B) Images of WT (dark green) or NKL2 ΔLGIIK9het25 (light green) H3K9me3 ChIP-seq and gene (gray) tracks, displayed on IGV, of the entire LG II chromosome or enhanced regions. H3K9me3 ChIP-seq reads were mapped to the (A) WT nc14 or (B) NKL2 ΔLGIIK9het25 reference genomes. Numbers in the Fig. 3A enhanced panel count the heterochromatic regions from the LG II left telomere, while the black arrowheads show the LGIIK9het25 DNA deletion. The purple line shows the ~ 110 kb of DNA missing from the NKL2 genome (shifting all H3K9me3 peaks to the right of the deletion by ~ 110 kb). The red arrow in B shows the position of the inserted PtrpC::hph gene in NKL2
Fig. 4
Fig. 4
The LGIIK9het25 deletion alters the predicted TAD-like structures in the surrounding chromatin. (A) Contact probability heatmaps of DpnII (KR corrected) or MseI (raw) in situ Hi-C datasets of WT and ΔLGIIK9het25 strains primarily showing on-diagonal contacts at 5 kb bin resolution, mapped to the NKL2 ΔLGIIK9het25 reference genome. Wild type H3K9me3 ChIP-seq (green) and gene (gray) tracks shown below. The contact probability scalebar is shown to the left of each heatmap. Predicted TAD-like structures, as determined by hicFindTADs in hicExplorer, are indicated by black triangles. Black arrowheads indicate altered TAD-like structures surrounding the LGIIK9het25 deletion, while white arrowheads show changed TAD-like structures in flanking euchromatin. The red arrow shows the position of the PtrpC::hph gene inserted within the NKL2 reference genome, while the purple line shows increased chromatin contacts at the PtrpC promoter. (B) A heatmap of the changes in contact probability between MseI Hi-C datasets of WT and ΔLGIIK9het25 strains, displayed as in A. The TAD-like structures predicted in WT (black) or ΔLGIIK9het25 (blue) strains by hicFindTADs in hicExplorer are shown (triangles). (C) Contact probability heatmaps, presented as in A, of WT and ΔLGIIK9het25 strains in which DpnII and MseI Hi-C dataset were summed prior to KR correction
Fig. 5
Fig. 5
The predicted 3D folding of a single chromosome is changed with the LGIIK9het25 deletion. (A-B) Images depicting the predicted 3D structures of LG II from (A) WT or (B) NKL2 ΔLGIIK9het25 strains at 20 kb resolution. The green region highlights the LGIIK9het25 region in the WT structure. The enhanced image shows the chromatin folding of the LG II right arm surrounding the LGIIK9het25 region in a WT strain. The arrow shows the LGIIK9het25 deletion site
Fig. 6
Fig. 6
The LGIIK9het25 region deletion causes increased gene expression genome wide. (A) Volcano plots showing the log2 fold change from WT expression levels of all Neurospora genes verses adjusted p-values from (left) the NKL2 ΔLGIIK9het25 or (right) the Δdim-5 strains. Red points are genes with significant expression changes (log2 fold changes > 3.0 or < -3.0 and adjusted p-values < 0.001). The number of differentially expressed genes (DEGs) is indicated at the top. (B) Images of IGV tracks showing WT H3K9me3 ChIP-seq (green), genes (gray), or the “up” (log2 > 3.0; red) or “down” (log2 < -3.0; blue) DEGs. The purple “X” symbols cover LGIIK9het25, which is deleted in the NKL2 strain, while the black arrows show the positions of genes NCU08696 or dim-5 (NCU04402). (C-D) Images depicting the predicted 3D modeling of LG II from (C) WT or (D) NKL2 ΔLGIIK9het25 strains at 20 kb resolution. The green region highlights the LGIIK9het25 region in the WT structure, while 20 kb bins containing DEGs in the NKL2 strain, relative to a WT strain are colored red; the same bins are marked on both structures. The arrow in D shows the LGIIK9het25 deletion site
Fig. 7
Fig. 7
The predicted 3D genome structure and DEG positions are altered upon LGIIK9het25 deletion. (A-B) Images depicting the predicted 3D genome structure of (A) WT or (B) NKL2 ΔLGIIK9het25 strains. The left image in each panel is the side view of the genome structure; the right image is where the genome structure is rotated up 90°, showing the centromere cluster. The green region highlights the LGIIK9het25 region in the WT structure, while the 20 kb bins containing DEGs in the NKL2 ΔLGIIK9het25 strain are colored red

Update of

Similar articles

References

    1. Cremer T, Cremer C. Chromosome territories, nuclear architecture and gene regulation in mammalian cells. Nat Rev Genet. 2001;2:292–301. - PubMed
    1. Misteli T. Beyond the sequence: Cellular Organization of genome function. Cell. 2007;128:787–800. - PubMed
    1. Dekker J. Gene Regulation in the third dimension. Science. 2008;319:1793–4. - PMC - PubMed
    1. Sexton T, Cavalli G. The role of chromosome domains in shaping the functional genome. Cell. 2015;160:1049–59. - PubMed
    1. Bonev B, Cavalli G. Organization and function of the 3D genome. Nat Rev Genet. 2016;17:661–78. - PubMed