. 2024 Dec 19;22(1):782.
doi: 10.1186/s12951-024-02999-z.

Zinc-based radioenhancers to activate tumor radioimmunotherapy by PD-L1 and cGAS-STING pathway

Affiliations

Zinc-based radioenhancers to activate tumor radioimmunotherapy by PD-L1 and cGAS-STING pathway

Mengjiao Xu et al. J Nanobiotechnology. .

Abstract

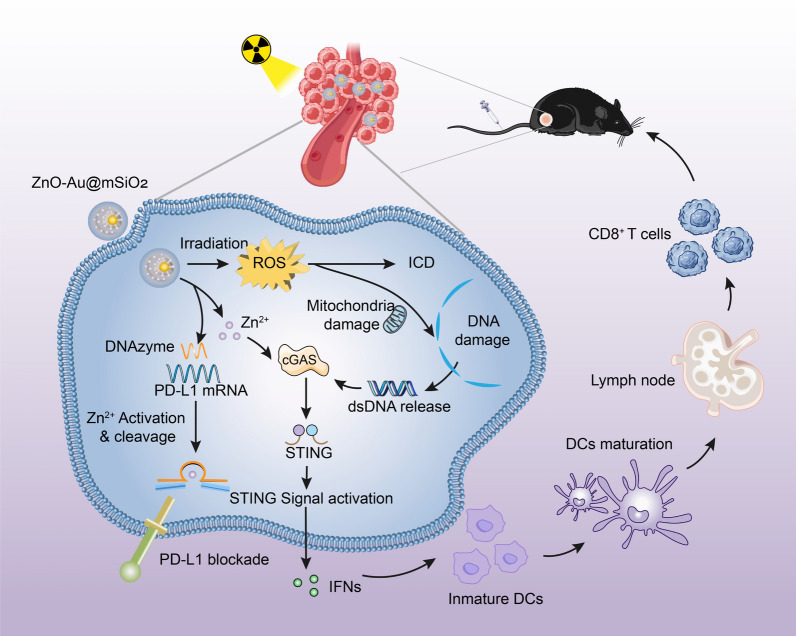
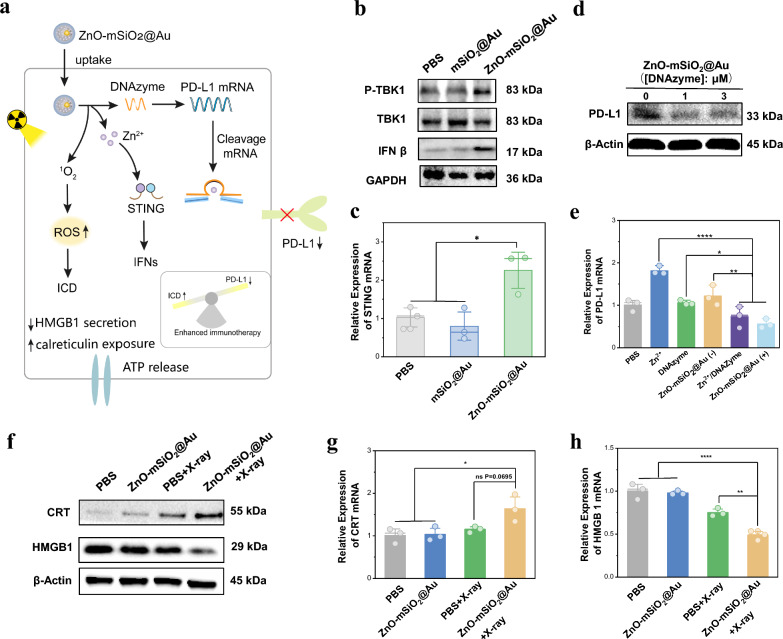
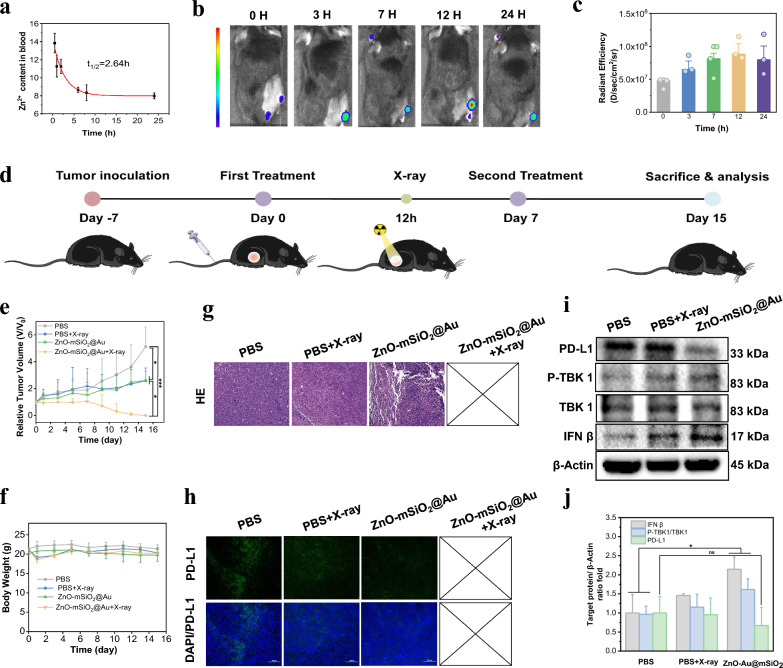
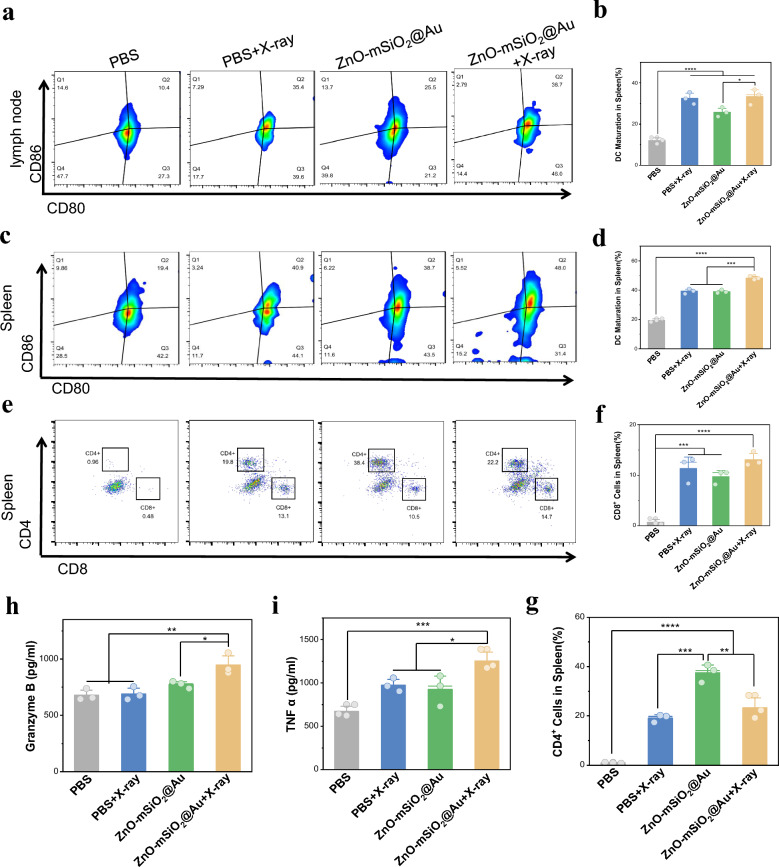
Radiotherapy and immunotherapy have already become the primary form of treatment for non-small-cell lung cancer (NSCLC), but are limited by high radiotherapy dose and low immune response rate. Herein, a multi-pronged strategy using a radio-immuno-enhancer (ZnO-Au@mSiO2) is developed by inducing tumor cells apoptosis and reprograming the immunosuppressive tumor microenvironment (TME). The radio-immuno-enhancer employed Au as a radiosensitizer, transition Zn ions as immune activators, which not only tremendously enhances the anti-proliferative activity of radiotherapy toward cancer cells, but also activates the immune response with multi-targets to let "exhausted" T cells "back to life" by triggering immunogenic cell death (ICD), immune checkpoint blockade (ICB) that target PD-1/PD-L1 and cGAS-STING under X-ray irradiation with a low dosage. The in vivo results demonstrate desirable antitumor and immunogenic effects of radio-immuno-enhancer-mediated immune activation by increasing the ratio of cytotoxic T cells (CTLs) and helper T cells. This work provides a feasible approach for future development of effective transition metal ion-activated radio-immunotherapeutic agents.


Conflict of interest statement

Declarations. Ethics approval and consent to participate: All animal experiments were approved by the Animal Management and Ethics Committee of the Xiamen University. Consent for publication: Not applicable. Competing interests: The authors declare no competing interests.

Figures

Scheme 1
Scheme 1
Scheme illustration of the ZnO–Au@mSiO2 NPs for cancer immunotherapy. Mesoporous silica-encapsulated gold (Au@mSiO2) nanoparticles were used as carriers for Zn2+-dependent DNAzyme, which can act to degrade PD-L1, only after being activated by Zn2+. ZnO, as a double activator for DNAzyme and cGAS-STING, was used as a “caretaker” to block off the pore of the SiO2 for stability and safety (ZnO–Au@mSiO2). The nanoparticles exposed to X-ray could enhance oxidative stress and immunogenic cell death (ICD), which would cause tumor cell apoptosis and activate the tumor immune response; the released Zn2+ in acidic microenvironment activate the cGAS-STING signaling pathway for further amplifying the immune response, and activate DNAzyme for regulating PD-1/PD-L1 immunosuppression
Fig. 1
Fig. 1
Preparation and characterization of ZnO–Au@mSiO2. a Synthetic route of ZnO–Au@mSiO2 nanocomposites. b TEM imaging of ZnO–Au@mSiO2 nanoparticles. c STEM mapping analysis of ZnO–Au@mSiO2. d UV–vis absorption spectra of ZnO–Au@mSiO2. e The hydrodynamic diameter of structures. f Zeta potentials of structures. g Release of Zn2+ from ZnO–Au@mSiO2 under different conditions (pH 5.8, pH 6.5 and pH 7.4). h Schematic diagram of Zn2+ release leading to activation of DNAzyme to cleavage target mRNA. i Gel electrophoresis images showing DNAzyme efficiency for substrate cleavage
Fig. 2
Fig. 2
In vitro inhibition of tumor cell growth. a Cell uptake on LLC cells incubated with ZnO–Au@mSiO2 analyzed by Flow cytometry at different time. b Intracellular ·OH generation detected by DCFH-DA probe (scale bar, 20 μm). c Flow cytometry data for DCFH-DA probe treated with different therapeutic groups. d Detection of lipid peroxidation by BODIPY-C11 staining in LLC cells incubated with different groups. e Cell viabilities of LLC cells and LO2 cells measured by MTT assays, after incubating with different concentration of ZnO–Au@mSiO2 with or without X-ray. f Flow cytogram representing apoptosis assay based on Annexin V-FITC and propidium iodide staining of LLC cells after treatment with different therapeutic groups. Group 1: PBS, Group 2: PBS + X-ray, Group 3: Au@mSiO2, Group 4: Au@mSiO2 + X-ray, Group 5: ZnO–Au@mSiO2u, Group 6: ZnO–Au@mSiO2 + X-ray
Fig. 3
Fig. 3
In vitro effects of mitochondrial damage, DNA damage, and proliferation ability. a Schematic diagram of the cGAS-STING signaling pathway induced by Zn2+ and RT in tumor cells. b CLSM observation on the changes in the mitochondrial membrane potential of LLC cells after incubation with different treatment. The blue, red, and green colors indicate cell nucleus, and JC-1 aggregates and monomer, respectively (scale bar, 30 μm). c Flow cytometry analysis of mitochondrial membrane potentials using JC-1 after different treatments. d Active mitochondria were stained by mitochondrial probe Mito-Tracker Green after treatment with different groups and detected by FCM. e TEM images of mitochondrial morphological changes of LLC cells with different treatments (scale bar, local images: 1 μm, enlarged cell sections images: 200 nm). f The immunofluorescence images of γ-H2AX induced by DNA damage (scale bar, 10 μm). g The photographs of colony formation assay of LLC cells treated with PBS and different concentration of ZnO–Au@mSiO2 under various radiation doses (0, 2, 4, 6 and 8 Gy). h Colony formation rate after treatment with ZnO–Au@mSiO2. i Cell cycle analysis of LLC cells treated with PBS and ZnO–Au@mSiO2 with or without X-ray and j analysis of flow cytometry
Fig. 4
Fig. 4
In vitro gene editing, RT-induced ICD and the cGAS-STING signal pathway-related genetic changes. a The role of ZnO–Au@mSiO2 nanosystem after entering the cells. b Western blotting analysis for protein expression of cGAS-STING-associated proteins (IFN β, TBK1 and p-TBK1) in DC 2.4 cells. c qPCR assay measuring the STING mRNA in DC 2.4 cells (*p < 0.05). d Western blotting analysis for protein expression of PD-L1 in LLC cells. e qPCR assay measuring the PD-L1 mRNA in LLC cells, ZnO–Au@mSiO2 (–) indicates that DNAzyme is not loaded, ZnO–Au@mSiO2 ( +) indicates that DNAzyme is loaded (*p < 0.05, **p < 0.01, ****p < 0.0001). f Western blotting analysis for protein expression of ICD-associated proteins (HMGB1 and CRT) in LLC cells. g qPCR assay measuring the CRT mRNA in LLC cells (*p < 0.05 and ns means no significant difference). h qPCR assay measuring the HMGB1 mRN A in LLC cells (**p < 0.01, ****p < 0.0001)
Fig. 5
Fig. 5
In vivo biodistribution and anti-tumor efficacy. a Pharmacokinetics of ZnO–Au@mSiO2. b Fluorescence imaging of mice bearing LLC tumor at 0, 3, 7, 12, 24 h post-injection intravenously of ZnO–Au@mSiO2-Cy5.5 (n = 3). c The corresponding fluorescence signals of subcutaneous tumors at 0, 3, 7, 12, 24 h post-injection intravenously of ZnO–Au@mSiO2-Cy5.5. d Schematic illustration of the treatment process in mice bearing tumor. e The administration of the tumor volume changes in different treatment groups (n = 3) (*p < 0.05, ***p < 0.001). f The administration of mouse body weights in different treatment groups (n = 3). g Representative H&E staining images of tumor tissues collected from group 1, group 2 and group 3 (scale bar, 100 μm). h Immunofluorescence staining of PD-L1 in the tumor slices collected from group 1, group 2 and group 3 (scale bar, 100 μm). i Western blotting analysis for protein expression of PD-L1 and cGAS-STING-associated proteins (IFN β, TBK1 and p-TBK1) in tumor tissues. j The relative protein levels of survivin after different treatments
Fig. 6
Fig. 6
In vivo antitumor immune responses. a Representative flow cytometry plots and b corresponding quantification of DCs maturation in lymph node tissues (n = 3) (*p < 0.05, ****p < 0.0001). c Representative flow cytometry plots and d corresponding quantification of DCs maturation in spleen tissues (n = 3) (***p < 0.001, ****p < 0.0001). e Representative flow cytometry plots and f, g corresponding quantification of CTLs in spleen tissues (n = 3) (**p < 0.01, ***p < 0.001, ****p < 0.0001). h The expression levels of TNF-α and i Granzyme in serum analyzed by ELISA kit (*p < 0.05, **p < 0.01, ***p < 0.001)

References

    1. Thai AA, Solomon BJ, Sequist LV, Gainor JF, Heist RS. Lung cancer. Lancet. 2021;398:535–54. - PubMed
    1. Passaro A, Brahmer J, Antonia S, Mok T, Peters S. Managing resistance to immune checkpoint inhibitors in lung cancer: treatment and novel strategies. J Clin Oncol. 2022;40:598–610. - PubMed
    1. Dasgupta Q, Jiang A, Wen AM, Mannix RJ, Man Y, Hall S, Javorsky E, Ingber DE. A human lung alveolus-on-a-chip model of acute radiation-induced lung injury. Nat Commun. 2023;14:6506–20. - PMC - PubMed
    1. Arroyo-Hernández M, Maldonado F, Lozano-Ruiz F, Muñoz-Montaño W, Nuñez-Baez M, Arrieta O. Radiation-induced lung injury: current evidence. BMC Pulm Med. 2021;21:9–21. - PMC - PubMed
    1. Käsmann L, Dietrich A, Staab-Weijnitz CA, Manapov F, Behr J, Rimner A, Jeremic B, Senan S, De Ruysscher D, Lauber K, Belka C. Radiation-induced lung toxicity-cellular and molecular mechanisms of pathogenesis, management, and literature review. Radiat Oncol. 2020;15:214–30. - PMC - PubMed

MeSH terms

LinkOut - more resources