. 2024 Dec 19;15(1):10705.
doi: 10.1038/s41467-024-55384-7.

Origin and cross-species transmission of bat coronaviruses in China

Affiliations

Origin and cross-species transmission of bat coronaviruses in China

Alice Latinne et al. Nat Commun. .

Abstract

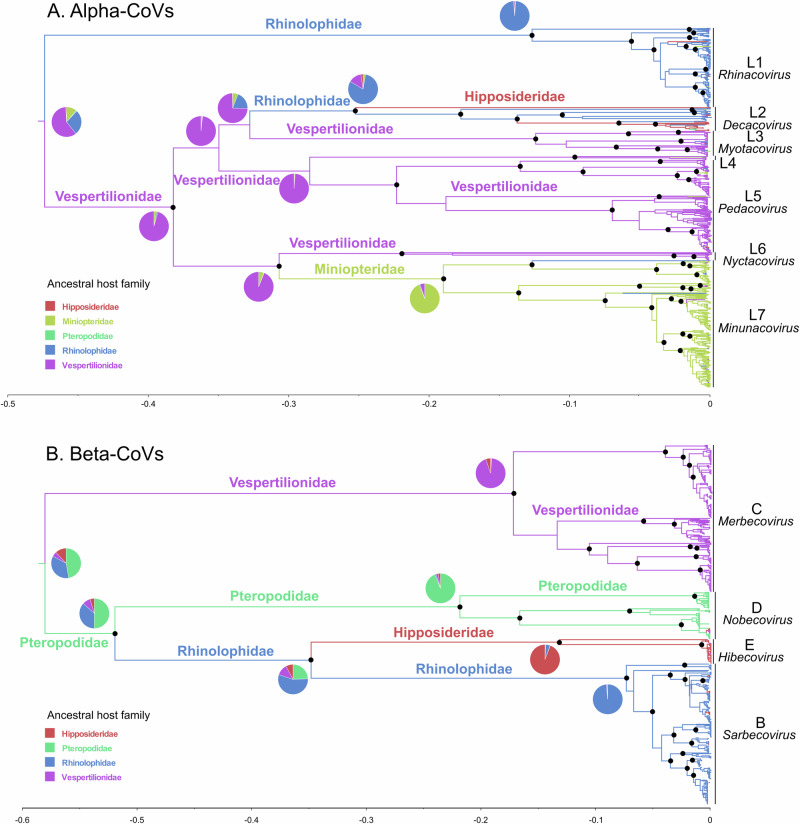
Bats are presumed reservoirs of diverse coronaviruses (CoVs) including progenitors of Severe Acute Respiratory Syndrome (SARS)-CoV and SARS-CoV-2, the causative agent of COVID-19. However, the evolution and diversification of these coronaviruses remains poorly understood. Here we use a Bayesian statistical framework and a large sequence data set from bat-CoVs (including 589 novel CoV sequences) in China to study their macroevolution, cross-species transmission and dispersal. We find that host-switching occurs more frequently and across more distantly related host taxa in alpha- than beta-CoVs, and is more highly constrained by phylogenetic distance for beta-CoVs. We show that inter-family and -genus switching is most common in Rhinolophidae and the genus Rhinolophus. Our analyses identify the host taxa and geographic regions that define hotspots of CoV evolutionary diversity in China that could help target bat-CoV discovery for proactive zoonotic disease surveillance. Finally, we present a phylogenetic analysis suggesting a likely origin for SARS-CoV-2 in Rhinolophus spp. bats.


Conflict of interest statement

Competing interests: The authors declare no competing interests.

Figures

Fig. 1
Fig. 1. Geographic location of sample collection sites from which RdRp CoV sequences were identified in the current study.
Pie chart (A) showing the number of sequences of each CoV genus (α-CoVs and β-CoVs) available for each zoogeographic region and map of China provinces (B) showing the number of RdRp sequences available for each province, in bold gray for α-CoVs and black for β-CoVs. Province colors correspond to the zoogeographic region to which they belong: NO Northern region, CN Central northern region, SW South western region, CE Central region, SO Southern region, HI Hainan island. The three β-CoV sequences from HI were included in the SO region. Provinces colored in gray are those where CoV sequences are not available.
Fig. 2
Fig. 2. Phylogenetic trees and ancestral host reconstructions for RdRp sequences of coronaviruses from bats in China.
α-CoV (A) and β-CoV (B) maximum clade credibility annotated trees using complete datasets of RdRp sequences and bat host family as discrete character state. Pie charts located at the root and close to the deepest nodes show the state posterior probabilities for each bat family. Branch colors correspond to the inferred ancestral family with the highest probability. Branch lengths are scaled according to relative time units (clock rate = 1.0). Well-supported nodes (posterior probability > 0.95) are indicated with a black dot. The ICTV approved CoV subgenera were highlighted: Rhinacovirus (L1), Decacovirus (L2), Myotacovirus (L3), Pedacovirus (L5), Nyctacovirus (L6), Minunacovirus (L7), and an unidentified lineage (L4) for α-CoVs; and Merbecovirus (Lineage C), Nobecovirus (lineage D), Hibecovirus (lineage E), and Sarbecovirus (Lineage B) for β-CoVs.
Fig. 3
Fig. 3. Phylogenetic relationships among bat-origin RdRp sequences within the Sarbecovirus subgenus (β-CoVs).
Maximum clade credibility tree (A) including 197 RdRp sequences from the Sarbecovirus subgenus isolated in bats, two sequences of SARS-CoV-2, and one sequence of SARS-CoV isolated in humans and eight sequences isolated in Malayan pangolins (Manis javanica). Well-supported nodes (posterior probability > 0.95) are indicated with a black dot. Tip colors correspond to the host genus; SARS-CoV-2 sequences and SARS-CoV sequence are highlighted in gray and black, respectively. Median-joining network (B) including 197 RdRp sequences from the Sarbecovirus lineage isolated in bats, two sequences of SARS-CoV-2, and one sequence of SARS-CoV isolated in humans and eight sequences isolated in Malayan pangolins (Manis javanica). Colored circles correspond to distinct CoV sequences, and circle size is proportional to the number of identical sequences in the dataset. Small black circles represent median vectors (ancestral or unsampled intermediate sequences). Branch length is proportional to the number of mutational steps between haplotypes.
Fig. 4
Fig. 4. Inter-family host switches among alpha- and beta-coronaviruses from bats in China inferred from RdRp sequence analysis.
Strongly supported host switches between bat families for α-CoVs (A) and β-CoVs (B). Arrows indicate the direction of the switch; arrow thickness is proportional to the switch significance level, only host switches supported by strong Bayes factor (BF) > 10 are shown. Histograms of total number of host-switching events (state changes counts using Markov jumps) from/to each bat family along the significant inter-family switches for α-CoVs (C) and β-CoVs (D).
Fig. 5
Fig. 5. Inter-genus host switches among alpha- and beta-coronaviruses from bats in China, inferred from RdRp sequence analysis.
Strongly supported host switches between bat genera for α-CoVs (A) and β-CoVs (B) and their significance level (Bayes factor, BF). Only host switches supported by strong BF values > 10 are shown. Line thickness is proportional to the switch significance level. Red lines correspond to host switches among bat genera belonging to different families, and black lines correspond to host switches among bat genera from the same family. Arrows indicate the direction of the switch. Genus names are colored according to the family they belong to using the same colors as in Figs. 2 and 3.
Fig. 6
Fig. 6. CoV spatiotemporal dispersal in China inferred from RdRp sequences.
Strongly supported dispersal routes (Bayes factor, BF > 10) over recent evolutionary history among China zoogeographic regions for α-CoVs (A) and β-CoVs (B). Arrows indicate the direction of the dispersal route; arrow thickness is proportional to the dispersal route significance level. Darker arrow colors indicate older dispersal events. Histograms of total number of dispersal events (Markov jumps) from/to each region along the significant dispersal routes for α-CoVs (C) and β-CoVs (D). NO Northern region, CN Central northern region, SW South western region, CE Central region, SO Southern region, HI Hainan island.
Fig. 7
Fig. 7. Phylogenetic diversity of alpha- and beta-coronaviruses from bats in China, inferred from RdRp sequences.
Metrics of CoV phylogenetic diversity within each bat family (A), genus (B), and zoogeographic regions (C): standardized effect size of mean phylogenetic distance (SES MPD), on the left panels; and standardized effect size of mean nearest taxon distance (SES MNTD), on the right panels. One-tailed p values (quantiles) were calculated after randomly reshuffling tip labels 1000 times along the entire phylogeny. Values departing significantly from the null model (p < 0.05) are indicated with an asterisk, all exact p values are available in Supplementary Tables 14–27. NO Northern region, CN Central northern region, SW South western region, CE Central region, SO Southern region, HI Hainan island.
Fig. 8
Fig. 8. Phylogenetic turnover/differentiation of CoVs among bat host taxa.
Standardized effect size of mean phylogenetic distance (SES MPD) and phylogenetic ordination among bat host families (A, B) and genera (C, D) for α- and β-CoVs. Boxplots for each host family and genus show the mean (cross), median (dark line within the box), interquartile range (box), 95% confidence interval (whisker bars), and outliers (dots), calculated from all pairwise comparisons between bat families (n = 10 for α-CoVs and n = 6 for β-CoVs) and genera (n = 91 for α-CoVs and n = 91 for β-CoVs).
Fig. 9
Fig. 9. Phylogenetic turnover/differentiation of CoVs among zoogeographic regions in China.
Standardized effect size of mean phylogenetic distance (SES MPD) and phylogenetic ordination among zoogeographic regions for α-CoVs (A) and β-CoVs (B). Boxplots for each region show the mean (cross), median (dark line within the box), interquartile range (box), 95% confidence interval (whisker bars), and outliers (dots), calculated from all pairwise comparisons between regions (n = 15 for α-CoVs and n = 10 for β-CoVs). NO Northern region, CN Central northern region, SW South western region, CE Central region, SO Southern region, HI Hainan island.

References

    1. Forni, D., Cagliani, R., Clerici, M. & Sironi, M. Molecular evolution of human coronavirus genomes. Trends Microbiol.25, 35–48 (2017). - PMC - PubMed
    1. Tao, Y. et al. Surveillance of bat coronaviruses in Kenya identifies relatives of human coronaviruses NL63 and 229E and their recombination history. J. Virol.91, e01953-16 (2017). - PMC - PubMed
    1. Graham, R. L. & Baric, R. S. Recombination, reservoirs, and the modular spike: mechanisms of coronavirus cross-species transmission. J. Virol. 84, 3134–3146 (2010). - PMC - PubMed
    1. Vijgen, L. et al. Evolutionary history of the closely related group 2 coronaviruses: porcine hemagglutinating encephalomyelitis virus, bovine coronavirus, and human coronavirus OC43. J. Virol.80, 7270–7274 (2006). - PMC - PubMed
    1. Zhang, X. et al. Quasispecies of bovine enteric and respiratory coronaviruses based on complete genome sequences and genetic changes after tissue culture adaptation. Virology363, 1–10 (2007). - PMC - PubMed

Publication types

MeSH terms