. 2024 Dec 19;10(1):63.
doi: 10.1038/s41514-024-00189-7.

Age- and sex-related variations in extracellular vesicle profiling for the assessment of cardiovascular risk: the EVaging index

Affiliations

Age- and sex-related variations in extracellular vesicle profiling for the assessment of cardiovascular risk: the EVaging index

Jacopo Burrello et al. NPJ Aging. .

Abstract

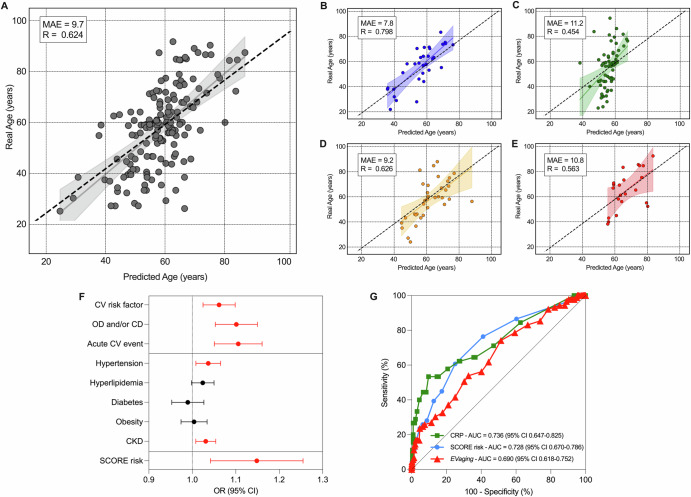
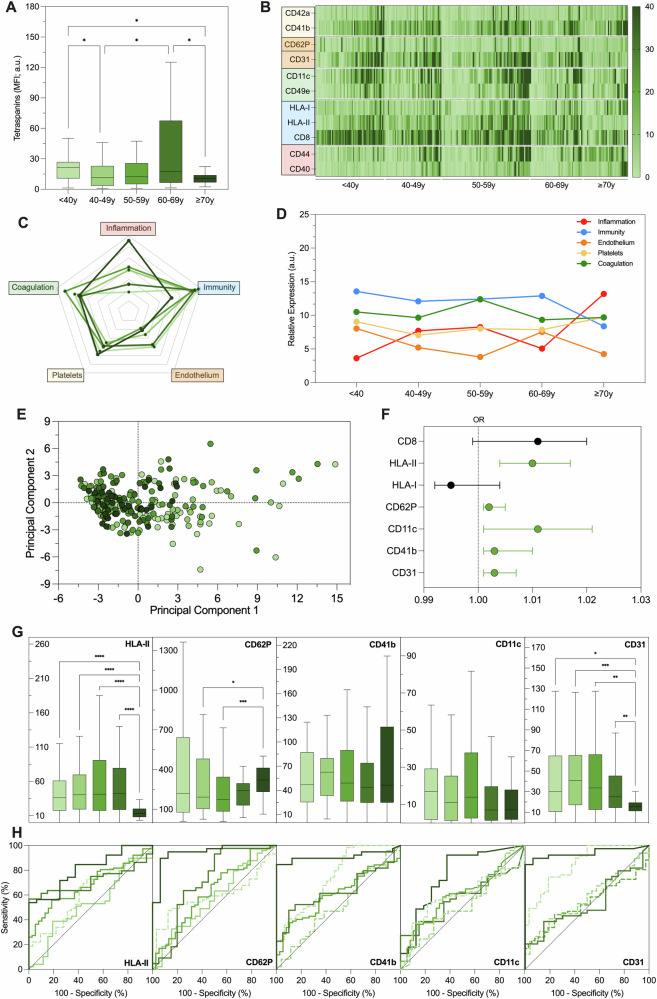
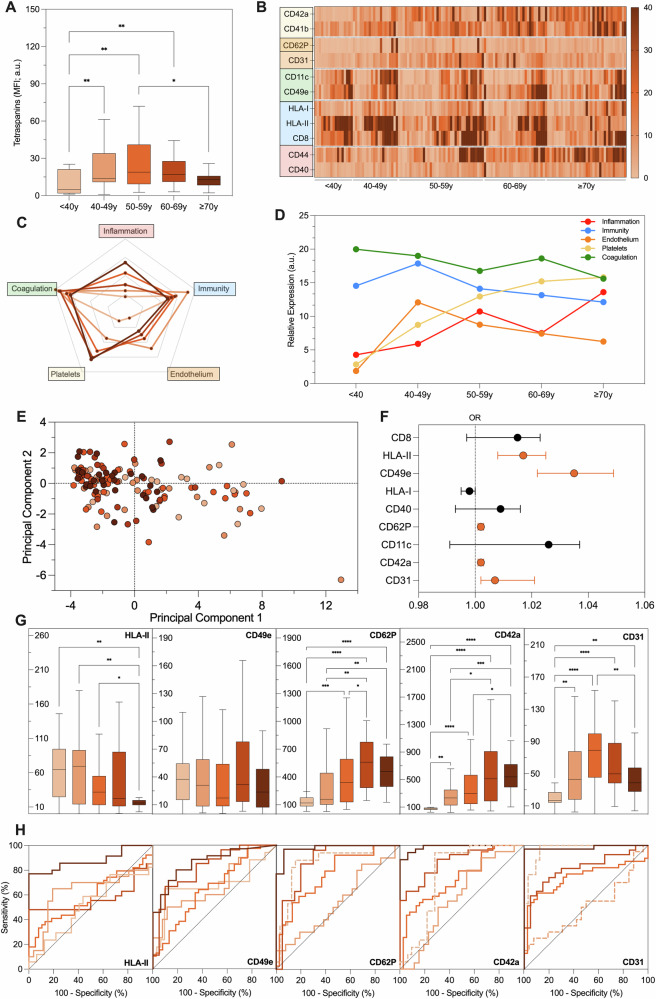
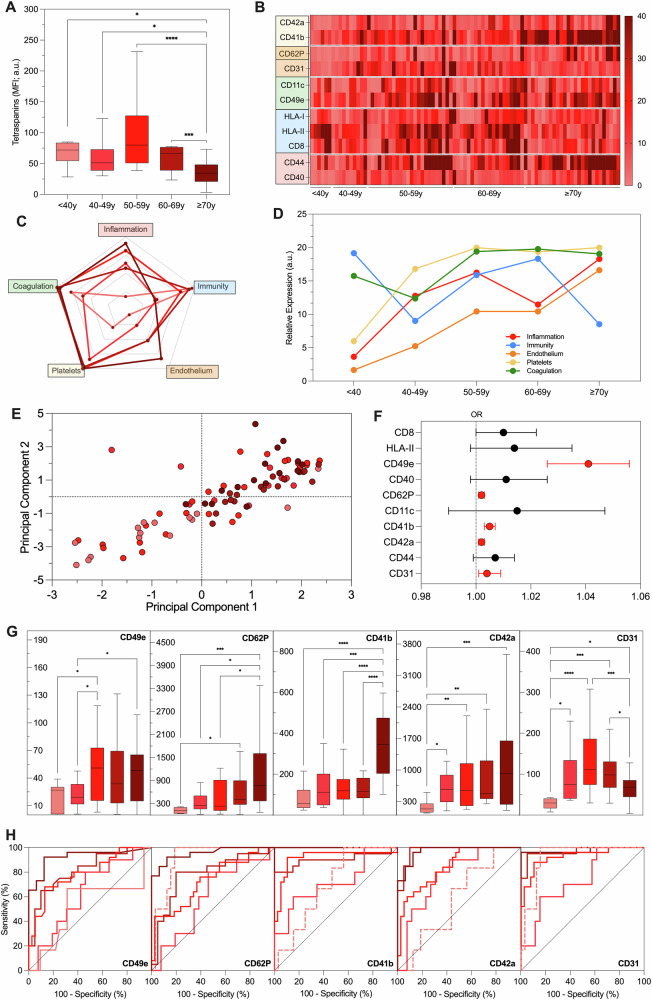
Extracellular vesicles (EVs) offer valuable diagnostic and prognostic insights for cardiovascular (CV) diseases, but the influence of age-related chronic inflammation ("inflammaging") and sex differences on EV profiles linked to CV risk remains unclear. This study aimed to use EV profiling to predict age and stratify patients by CV risk. We developed an EVaging index by analyzing surface antigen profiles of serum EVs from 625 participants, aged 20 to 94 years, across varying CV risk groups. The EVaging index was associated with age in healthy individuals and distinguished CV risk profiles in patients, correlating with CV outcomes and likelihood of fatal CV events according to the European Society of Cardiology (ESC) SCORE, and reflecting age-associated comorbidities. While changes in disease-related EV fingerprint adds complexity in CV patients, EV profiling may help assess biological aging and CV risk, emphasizing EVs' roles in inflammaging.


Conflict of interest statement

Competing interests: The authors declare no competing interests.

Figures

Fig. 1
Fig. 1. EV profiling predicts the age: the EVaging index.
Data from EV profiling were used to train and validate a machine learning model (support vector regressor with RBF kernel) able to predict the age starting from levels of the 37 evaluated EV surface antigens in the overall cohort (A) and among healthy controls (B), patients with a CV risk factor (C), with organ damage and/or cardiac disease (D), and those after an acute CV event (E). For model generation, 75% of the dataset was used for training and 25% for testing. Prediction curves and 95% confidence intervals, mean absolute error (MAE), and Pearson’s R are shown for each model at validation (see Supplementary Fig. S2 for the visualization of EVaging performance at training of the model). F Forest plot reporting age-adjusted logistic and linear regression models to associate EVaging index with single CV risk indicators and ESC (European Society of Cardiology) SCORE risk. G ROC curves comparing the performance of C-reactive protein (CRP), ESC SCORE risk, and EVaging index in the detection of an acute CV event.
Fig. 2
Fig. 2. EV profiling in healthy controls.
EV surface antigens were evaluated by FC in 132 healthy controls (HC), after stratification for age. A Tetraspanin levels (MFI; a.u.). B Heat map reporting EV markers differentially expressed in HC. C EV antigens differentially expressed in HC after stratification for age. D Radar charts of putative biological processes attributed to EV antigens differentially expressed in HC (platelets [CD41b, CD42a, CD62P]; endothelium [CD31, CD62P]; coagulation [CD11c, CD49e]; immunity [CD8, HLA-I, HLA-II]; inflammation [CD40, CD44]). E Evaluation of biological processes associated with differentially expressed EV markers during aging. F Matrix showing correlations between age and EV antigens (scale ranging between blue and red, for inverse and direct correlations. G Principal component analysis showing an age shift of patients visualized according to their EV profile; each point represents a patient and decades of age are reported in shade of blue (light = younger; dark = older). Risk factors (RF); Cardiovascular events (CVE). *P < 0.01; **P < 0.05; ***P < 0.001; ****P < 0.0001.
Fig. 3
Fig. 3. EV profiling in subjects with cardiovascular risk factors.
EV surface antigens were evaluated by FC in 268 subjects with at least one CV risk factor (hypertension, hyperlipidemia, diabetes, obesity, or CKD), after stratification for age. A Tetraspanin levels (MFI; a.u.). B Heat map reporting, in this cohort, EV markers differentially expressed in HC. C Radar charts of putative biological processes attributed to EV antigens differentially expressed in HC (platelets [CD41b, CD42a, CD62P]; endothelium [CD31, CD62P]; coagulation [CD11c, CD49e]; immunity [CD8, HLA-I, HLA-II]; inflammation [CD40, CD44]). D Evaluation of biological processes associated with differentially expressed EV markers during aging. E Principal component analysis showing an age shift of patients visualized according to their EV profile; each point represents a patient and decades of age are reported in shade of green (light = younger; dark = older). F Forest plot reporting EV antigens associated with the presence of a CV risk factor, independently from age (in green). G EV antigens associated with a CV risk factor independently from age, after stratification for age (nMFI; %). H Discrimination of subjects with at least a CV risk factor from HC; ROC curves were drawn for EV antigens associated with a CV risk factor, independently from age, after stratification for decades of age (green; light = younger, dark = older). *P < 0.01; **P < 0.05; ***P < 0.001; ****P < 0.0001.
Fig. 4
Fig. 4. EV profiling in patients with organ damage and/or established cardiac disease.
EV surface antigens were evaluated by FC in 138 patients with established cardiac disease (coronary artery disease, and or chronic heart failure) and/or OD (microalbuminuria, or left ventricular hypertrophy), after stratification for age. A Tetraspanin levels (MFI; a.u.). B Heat map reporting, in this cohort, EV markers differentially expressed in HC. C Radar charts of putative biological processes attributed to EV antigens differentially expressed in HC. D Evaluation of biological processes associated with differentially expressed EV markers during aging. E Principal component analysis showing an age shift of patients visualized according to their EV profile; each point represents a patient and decades of age are reported in shade of orange (light = younger; dark = older). F Forest plot reporting EV antigens associated with the presence of cardiac disease and/or OD, independently from age (in orange). G EV antigens associated with cardiac disease/OD independently from age, after stratification for age (nMFI; %). H Discrimination of subjects with at established cardiac disease and/or OD from HC; ROC curves were drawn for EV antigens associated with a cardiac disease/OD, independently from age, after stratification for decades of age. *P < 0.01; **P < 0.05; ***P < 0.001; ****P < 0.0001.
Fig. 5
Fig. 5. EV profiling in patients after a cardiovascular event.
EV surface antigens were evaluated by FC in 87 patients after an acute CV event, after stratification for age. A Tetraspanin levels (MFI; a.u.). B Heat map reporting, in this cohort, EV markers differentially expressed in HC. C Radar charts of putative biological processes attributed to EV antigens differentially expressed in HC. D Evaluation of biological processes associated with differentially expressed EV markers during aging. E Principal component analysis showing an age shift of patients visualized according to their EV profile; each point represents a patient and decades of age are reported in shade of red (light = younger; dark = older). F Forest plot reporting EV antigens associated with an acute CV event, independently from age (in red). G EV antigens associated with an acute CV event independently from age, after stratification for age (nMFI; %). H Discrimination of subjects after an acute CV event from HC; ROC curves were drawn for EV antigens associated with acute CV events, independently from age, after stratification for decades of age. *P < 0.01; **P < 0.05; ***P < 0.001; ****P < 0.0001.

References

    1. Kennedy, B. K. et al. Geroscience: Linking Aging to Chronic Disease. Cell159, 709–713 (2014). - PMC - PubMed
    1. Morrisette-Thomas, V. et al. Inflamm-aging does not simply reflect increases in pro-inflammatory markers. Mech. Ageing Dev.139, 49–57 (2014). - PMC - PubMed
    1. Beharka, A. A. et al. Interleukin-6 production does not increase with age. J. Gerontol. A Biol. Sci. Med. Sci.56, B81–B88 (2001). - PubMed
    1. Ahluwalia, N. et al. Cytokine production by stimulated mononuclear cells did not change with aging in apparently healthy, well-nourished women. Mech. Ageing Dev.122, 1269–1279 (2001). - PubMed
    1. Chatterjee, M. et al. Plasma extracellular vesicle tau and TDP-43 as diagnostic biomarkers in FTD and ALS. Nat. Med.30, 1771–1783 (2024). - PMC - PubMed

LinkOut - more resources