. 2024 Dec 19;15(1):10703.
doi: 10.1038/s41467-024-55226-6.

Reliability of high-quantity human brain organoids for modeling microcephaly, glioma invasion and drug screening

Affiliations

Reliability of high-quantity human brain organoids for modeling microcephaly, glioma invasion and drug screening

Anand Ramani et al. Nat Commun. .

Erratum in

Abstract

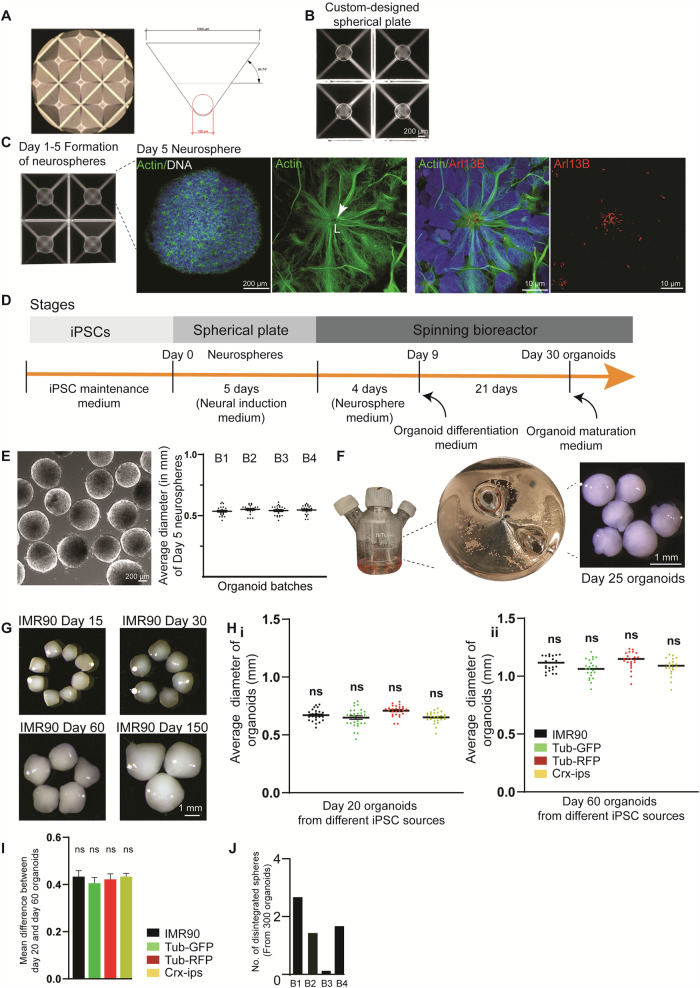
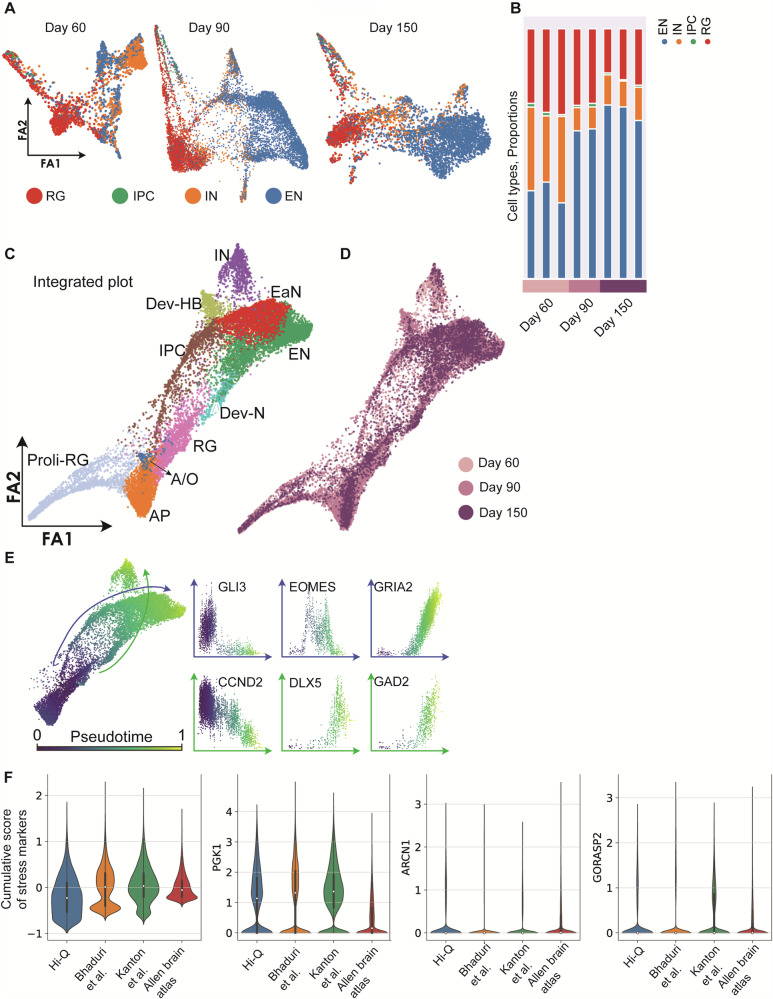
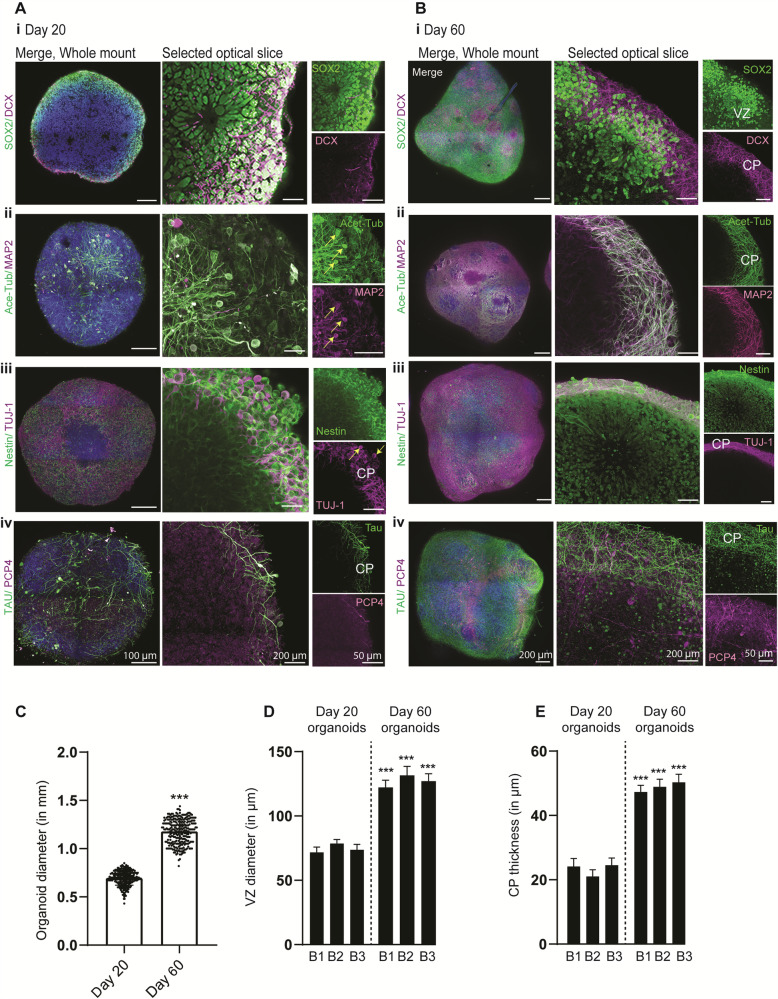
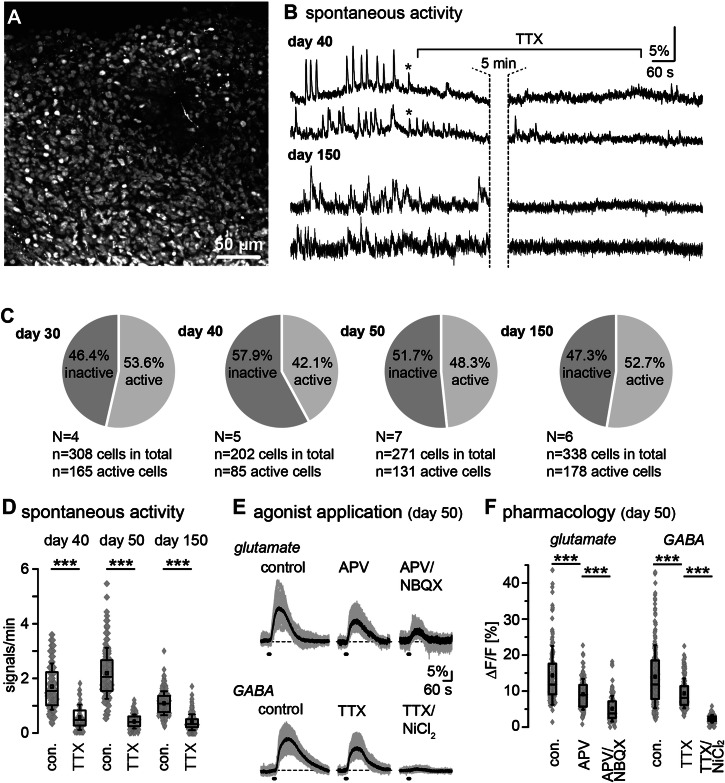
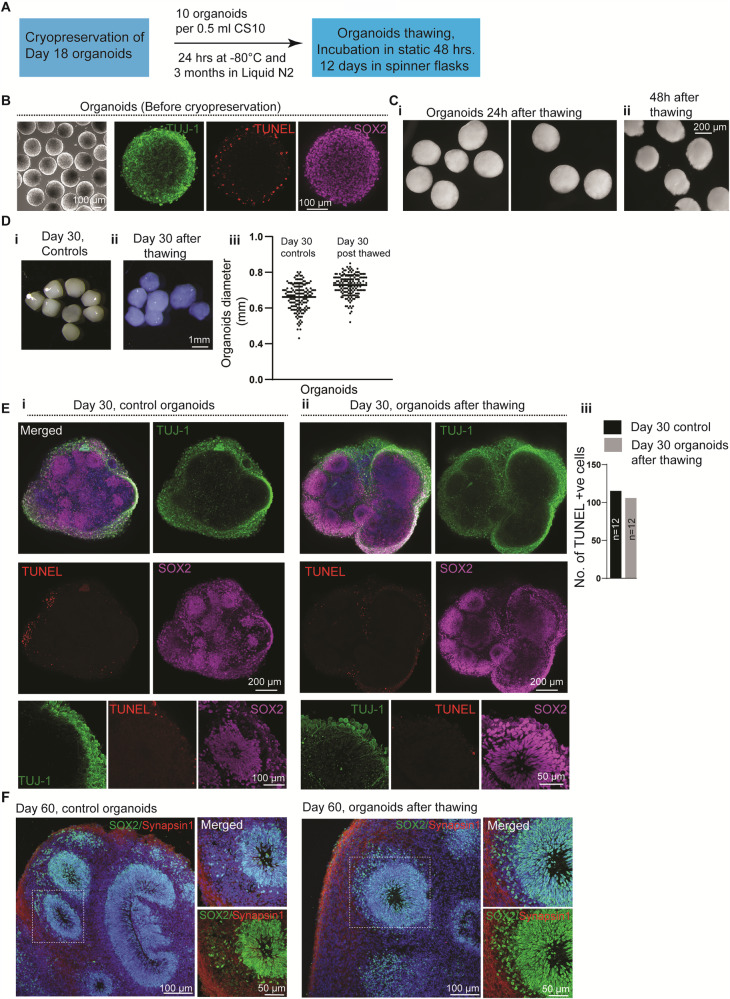
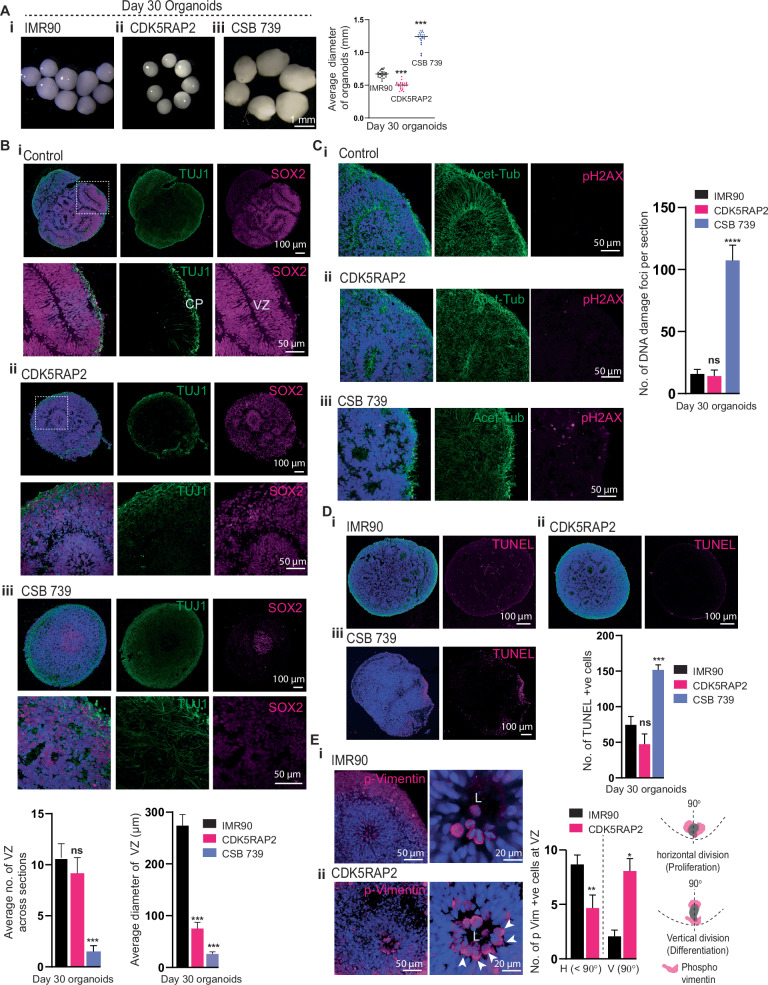
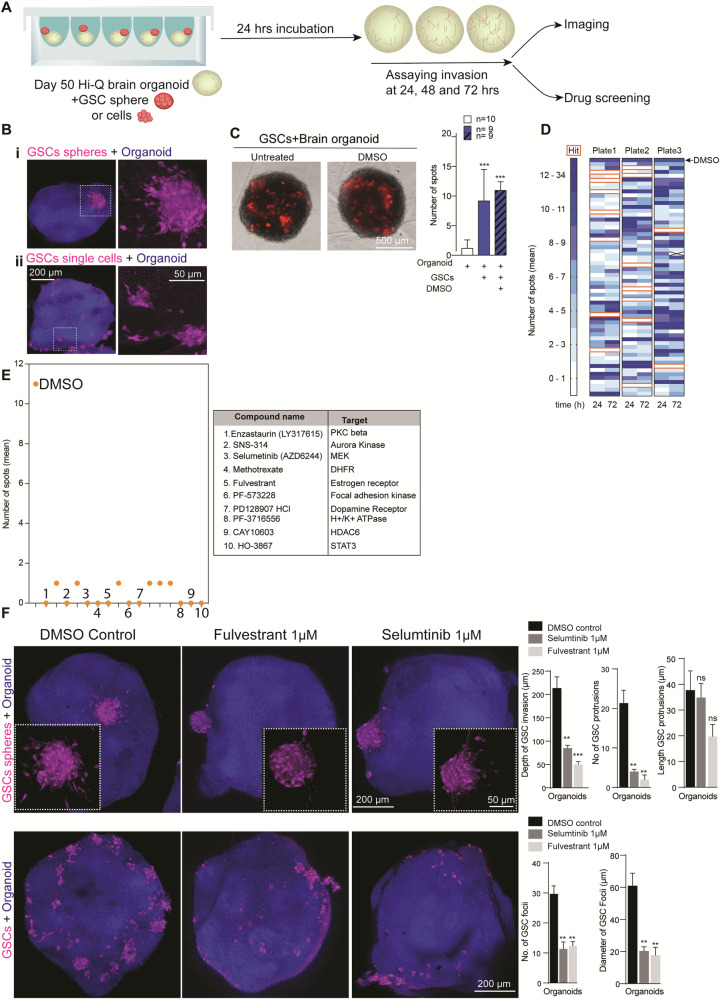
Brain organoids offer unprecedented insights into brain development and disease modeling and hold promise for drug screening. Significant hindrances, however, are morphological and cellular heterogeneity, inter-organoid size differences, cellular stress, and poor reproducibility. Here, we describe a method that reproducibly generates thousands of organoids across multiple hiPSC lines. These High Quantity brain organoids (Hi-Q brain organoids) exhibit reproducible cytoarchitecture, cell diversity, and functionality, are free from ectopically active cellular stress pathways, and allow cryopreservation and re-culturing. Patient-derived Hi-Q brain organoids recapitulate distinct forms of developmental defects: primary microcephaly due to a mutation in CDK5RAP2 and progeria-associated defects of Cockayne syndrome. Hi-Q brain organoids displayed a reproducible invasion pattern for a given patient-derived glioma cell line. This enabled a medium-throughput drug screen to identify Selumetinib and Fulvestrant, as inhibitors of glioma invasion in vivo. Thus, the Hi-Q approach can easily be adapted to reliably harness brain organoids' application for personalized neurogenetic disease modeling and drug discovery.


Conflict of interest statement

Competing interests: The authors (A.R., J.G., and E.G.) have filed an international patent related to the methodology and applications (Ref: PCT/EP2021/080414). J.G. and E.G. are co-founders of NeuronFab GmbH. All other authors declare no competing interests.

Figures

Fig. 1
Fig. 1. Generation of Hi-Q brain organoids.
A Microscopic view showing a custom-designed spherical plate with microwells and schematic view of the inverted pyramid-like microwell. The angles and measurements are shown. B hiPSC settles and readily forms spheres in the spherical plate’s microwells. The panel shows the scale bar. C Formation of neurospheres in the microwells of the spherical plate. The magnified image at the right shows a representative neurosphere. Magnified panels show a neural rosette stained with actin (green) with primary cilia emanating into the lumen (L) at the apical side of the rosette marked by Arl13B (Red). Panels show the scale bar. D Different stages of Hi-Q brain organoid generation. E A group of neurospheres. The graph at right shows no significant difference between the organoid diameter across four independent batches. At least twenty (n = 20) randomly chosen neurospheres were measured from each batch. Statistical analysis was done using one-way ANOVA, followed by Tukey’s multiple comparisons test. Data presented as mean ± SEM. The cell line used is IMR90. The panel shows the scale bar. F Maturation of neurospheres into Hi-Q brain organoids in spinner flasks. Macroscopic images show a group of organoids. The panel shows the scale bar. G Hi-Q brain organoids increase in size progressively over time from day 15 to day 150. The panel shows the scale bar. H The average diameter of twenty-day (i) and fifty-day (ii) old organoids were differentiated from four independent hiPSC lines. Note that there is no significant difference among the different hiPSC donors within each time point. At least twenty-five (n = 25) randomly chosen organoids were analyzed across three independent batches (N = 3). Statistical analysis was done using one-way ANOVA, followed by Tukey’s multiple comparisons test. Data presented as mean ± SEM. I The graph shows no size difference between twenty-day and sixty-day-old organoids, showing a regulated growth rate between two-time points. At least twenty-five (n = 25) randomly chosen organoids were analyzed across three independent batches (N = 3). Data distribution is given in the panel (H). Statistical analysis was done using one-way ANOVA, followed by Tukey’s multiple comparisons test. Data presented as mean ± SEM. J The bar diagram quantifies the number of disintegrated organoids in each batch. At least three hundred (n = 300) organoids were randomly sampled across four independent batches (N = 4).
Fig. 2
Fig. 2. Cell type diversity in Hi-Q brain organoids across maturation.
A Force Altas (FA) 2D representation of the neighbor graph of Hi-Q brain organoids at different time points of development (Day 60, 90, and 150). Cells are colored according to the label with the highest score given by the Lasso logistic regression model trained on primary brain data. B Histogram plot reporting the proportion of different cell types at different time points of development. C, D FA representation of the neighbor graph of the integrated datasets from all stages. In panel (C), clusters are annotated using the expressed gene markers: Pro-RG, proliferating radial glia; AP, apical progenitors; RG, radial glia; A/O, astrocytes, and oligodendrocytes; IPC, intermediate precursor cells; Dev-N, developing neurons; Dev-HB, developing hindbrain; EaN, early neurons; EN, excitatory neurons; IN, inhibitory neurons. In panel (D), cells are colored according to the time they were sampled. E The subset of the whole integrated dataset, except the pro-RG cluster, colored by pseudotime, showing the two trajectories of developing IN (green arrow) and EN (blue arrow). The scatter plots show the expression range of characteristic IN and EN genes for each cell in function of the pseudotime. F Violin plots compare the level of expression of PGK1, ARCN1, and GORASP2, as well as the cumulative score between Hi-Q brain organoids (nine organoids from three different age groups used in Fig. 2B), other brain organoids,, and primary data from the literature. The overlaid box indicates median, quartiles, and 1.5× IQR whiskers; outliers are individual points.
Fig. 3
Fig. 3. Hi-Q brain organoids mature over time.
A, B Tissue clearing and wholemount staining of day 20 (Ai-iv) and 60-day (Bi-iv) old organoids show that Hi-Q organoids mature over time. SOX2 and Nestin label NPCs at the ventricular zone (VZ), DCX, Acetylated tubulin, MAP2, TUJ-1, PCP4, and Tau mark neurons at the cortical plate (CP). Note cell body localization of acetylated α -tubulin, MAP2, and TUJ-1 (Arrows in Aii-iii) on day 20, organoids are remodeled into defined cortical plates (CP) on day 60 organoids (Bi-iii). Likewise, the cortical neuronal markers Tau and PCP4 were remodeled into distinct cortical plates in day 60 Hi-Q brain organoids (Aiv-Biv). Therefore, CPs are primitive or thin on day 20, and thick and distinct on day 60. Representative images are shown, and panels show scale bars. Diagrams quantify size differences between time points derived from at least 300 organoids (n = 300) from three independent batches (C), VZ diameter (D), and CP thickness (E). At least 100 organoids (n = 100) across several batches have been sampled for size comparison. At least 25 independent brain organoids (n = 25) have been sampled for VZ and CP thickness. Statistical analysis was carried out by One-way ANOVA, followed by Tukey’s multiple comparisons test, ***P < 0.001. Data presented as mean ± SEM.
Fig. 4
Fig. 4. Spontaneous and evoked activity in neural networks in Hi-Q brain organoids.
A Fluorescence intensity image of an organoid loaded with the calcium indicator OGB-1. B Exemplary traces of single cells revealing spontaneous calcium signaling in day 40 and day 150 old brain organoids. Asterisks highlight occasional synchronized activity. Wash-in of tetrodotoxin (TTX; 1 µM) strongly dampens spontaneous calcium signaling. C Pie charts illustrating active and inactive cells in brain organoids across all age groups (days 30, 40, 50, and 150). D Box plots showing median (line), mean (square), interquartile range (box), and standard deviation (whiskers) of the frequency of spontaneous calcium activity under control conditions and in the presence of TTX on day 40, 50, and 150 old brain organoids. Data are from three independent batches of the organoids in each age group, each containing at least four organoids (n = 4). Gray diamonds represent single data points/cells analyzed. E Intracellular calcium transients evoked by bath application of 1 mM glutamate (upper row) or 1 mM GABA (lower row) under control conditions and in the presence of ionotropic glutamate receptor inhibitors (APV for NMDARs and NBQX for AMPARs) or the presence of inhibitors of voltage- ion channels (TTX for Nav and NiCl2 for Cav) in day 50 brain organoids. Gray traces show individual cellular responses in one particular experiment; black traces are averages of the individual traces. F Box plots showing median (line), mean (square), interquartile range (box), and standard deviation (whiskers) glutamate- or GABA-induced calcium responses of day 50 brain organoids in control conditions and in the presence of indicated receptor/channel blockers. Data are from three independent batches of the organoids, each containing at least five organoids (n = 5). Gray diamonds represent single data points/cells analyzed. Gray diamonds are single data points/cells analyzed. For (D, E), data are presented in Tukey box-and-whisker plots indicating median (line), mean (square), interquartile range (IQR; box), and standard deviation (whiskers). In addition, all individual data points are shown in gray underneath the Tukey plots. Data were statistically analyzed using one-way ANOVA followed by a post hoc Bonferroni test. The following symbols are used to illustrate the results of statistical tests in the figures: *: 0.01 ≤p < 0.05; **: 0.001 ≤p < 0.01; ***: p < 0.001. “n” represents the number of cells analyzed; “N” means the number of individual experiments/brain organoids. Each series of experiments was performed on at least three different organoids.
Fig. 5
Fig. 5. Cryopreservation, thawing, and re-culturing of Hi-Q brain organoids.
A A schematic summarizes the cryopreservation and freeze-thawing of Hi-Q brain organoids. B Eighteen-day-old organoids before cryopreservation. TUJ-1 marks early neurons (green), TUNEL (red) shows the dead cells at the periphery, and SOX2 labels NPCs (magenta)—representative images from at least six experiments from three independent batches of neurospheres. Panels show the scale bar. C Hi-Q organoids 24 h after thawing (i) are still intact. After 48 h of thawing (ii), organoids show a slightly deformed edge. The panel shows the scale bar. D Day 30 Hi-Q organoids that have never been cryopreserved (i). The right panel (ii) shows a group of organoids after thawing. The color differences are due to different microscopes with filter settings. The panel shows the scale bar. (iii) At least eighty (n = 80) organoids from three independent batches (N = 3) were thawed and analyzed. One-way ANOVA carried out statistical analysis. There are no significant differences in the size of Hi-Q brain organoids between controls (never frozen) and freeze-thawed. Student’s t test carried out statistical analysis. Data presented as mean ± SEM. E, F Comparison of the cytoarchitecture of day-30 (E) Hi-Q brain organoid (control, never frozen) (i) and frozen and thawed organoid (ii). Magnified panels at the bottom show a ventricular zone (VZ) with its typical cytoarchitecture of early neurons (primitive cortical plate, green marked by TUJ-1) and proliferating NPCs (magenta marked by SOX2). TUNEL (red) labels dead cells; there is no difference between control and freeze-thawed organoids (n = 12) across two independent batches (N = 2) (iii). Panel (F) shows the cytoarchitecture of 60-day-old organoids stained with SOX2 (green) and Synapsin1 (red). Panels show scale bars. At least two randomly chosen organoids across two independent batches (N = 2) were compared to Day 20 controls.
Fig. 6
Fig. 6. Hi-Q brain organoids model microcephaly and brain organization defects.
A Comparison of healthy control (IMR90) and Hi-Q brain organoids derived from mutant patients harboring mutations in CDK5RAP2 and Cockayne syndrome B gene (CSB 739) (i-iii). CDK5RAP2 brain organoids (ii) are microcephalic as they are significantly smaller than healthy organoids. On the other hand, CSB organoids are significantly larger than healthy controls. The panel shows the scale bar. At least twenty (n = 20) randomly chosen day 30 organoids were analyzed across three independent batches (N = 3). Statistical analysis was carried out by One-way ANOVA, followed by Tukey’s multiple comparisons test, ***P < 0.001. Data presented as mean ± SEM. B Tissue sections of healthy control (IMR90), CDK5RAP2, and CSB 739 brain organoids (i-iii). The magnified panel under each variety shows VZ. SOX2 labels NPCs, and TUJ-1 marks primitive cortical plate (CP). Compared to healthy organoids (IMR90), CDK5RAP2 organoids have slightly disorganized and smaller VZ. Bar graphs at the bottom quantify the average number of VZs and their diameter in each kind. Panels show the scale bar. At least twenty sections (n = 20) from three different organoids of each group were analyzed. Statistical analysis was carried out by One-way ANOVA, followed by Tukey’s multiple comparisons test, ***P < 0.001. Data presented as mean ± SEM. C CSB 739 (iii) but not healthy (i) or CDK5RAP2 (ii) organoids display a significantly increased level of pH2AX-positive nuclei (magenta) indicative of DNA double-stranded breaks. The bar graph at the right quantifies the relative proportions of pH2AX-positive nuclei. Panels show the scale bar. An average of at least twenty sections (n = 20) from three different organoids of each group was considered. Statistical analysis was carried out by One-way ANOVA, followed by Tukey’s multiple comparisons test, ***P < 0.001. Data presented as mean ± SEM. D CSB 739 (iii) but not healthy (i) or CDK5RAP2 (ii) organoids display a significantly increased level of TUNNEL-positive cells (magenta) indicative of dead cells. The bar graph quantifies the relative proportions of TUNNEL-positive nuclei. An average of at least twenty sections (n = 20) from three different organoids of each group was considered. Statistical analysis was carried out by One-way ANOVA, followed by Tukey’s multiple comparisons test, ***P < 0.001. Data presented as mean ± SEM. Panels show the scale bar. E Hi-Q brain organoids reveal the kinetics of the apical progenitor division plane. P-Vimentin selectively labels the dividing apical progenitors at the VZ’s apical side. Healthy brain organoids (IMR90) predominantly display dividing progenitors whose division plane is horizontal to the VZ lumen (i). In contrast, CDK5RAP2 brain organoids (ii) harbor apical progenitors whose division plane is mainly vertical to the VZ lumen. The bar diagram quantifies the distribution of the division plane. H, horizontal. V, vertical. A schematic at the right shows horizontal and vertical division planes. An average of at least fifteen sections (n = 15) from three different organoids of each group was considered. Statistical analysis was carried out by One-way ANOVA, followed by Tukey’s multiple comparisons test, *P < 0.1. Data presented as mean ± SEM. Panels show the scale bar.
Fig. 7
Fig. 7. Hi-Q brain organoids allow glioma invasion assays and can adapt medium-throughput drug screening assays to identify anti-glioma compounds.
A Experimental scheme for a glioma invasion assay using Hi-Q brain organoids that can be adapted for drug screening. B Hi-Q brain organoids allow GSC invasion as spheres (i) or single cells (ii). The magnified panel at the right shows invading GSCs with their typical protrusions into the organoid tissues (arrows). The bar diagram at the right quantifies the depth invaded by GSCs. Shown are representative images from at least six experiments from three independent batches of organoids. Panels show the scale bar. C, D Assay design adapted to screen the compounds preventing GSC invasion. Representative images showing invading GSC into Hi-Q brain organoids (C). At least 12 organoids (n = 12) from three independent experiments were analyzed. Statistical analysis was carried out by One-way ANOVA, followed by Tukey’s multiple comparisons test, ***P < 0.001. Data presented as mean ± SEM. Automated imaging and computer-based counting of GSC spots in each organoid. Two organoids were tested for each compound. The algorithm assigns a space when there are no invading GSCs. Dark blue denotes more GSC spots in organoids. Each box represents a well that is supplied with a compound (D). E Dot plot shows the selected compounds that prevent GSC invasion into organoids. Each dot denotes the number of GSC spots in organoids. The table at the right lists selected ten compounds that can stop the GSCs’ invasions into brain organoids. The biological functions of each compound are also listed. F Quantitative 3D imaging of GSCs invasion into brain organoids. The top panel shows the GSC invasion from spheres. The bottom panel shows GSCs invasions from GSCs suspension. Fulvestrant and Selumtinib significantly prevent GSC invasion into brain organoids as selected compounds. The invaded GSC (as spheres or single cells) were marked with red arrowheads. White arrowheads point to the spheres or cells that fail to invade the organoids in the presence of drugs. Panels show the scale bar. The bar diagram quantifies the inhibitory effects of the selected compounds on GSC invasion. Average measurements from at least ten organoids (n = 10) per drug condition were considered. Statistical analysis was carried out by One-way ANOVA, followed by Tukey’s multiple comparisons test, ***P < 0.001, **P < 0.01. Data presented as mean ± SEM.

Comment in

References

    1. Eiraku, M. et al. Self-organizing optic-cup morphogenesis in three-dimensional culture. Nature472, 51–56 (2011). - PubMed
    1. Meng, X. et al. Assembloid CRISPR screens reveal impact of disease genes in human neurodevelopment. Nature622, 359–366 (2023). - PMC - PubMed
    1. Gabriel, E. et al. Human brain organoids assemble functionally integrated bilateral optic vesicles. Cell Stem Cell28, 1740–1757.e1748 (2021). - PubMed
    1. Pellegrini, L. et al. Human CNS barrier-forming organoids with cerebrospinal fluid production. Science36910.1126/science.aaz5626 (2020). - PMC - PubMed
    1. Kadoshima, T. et al. Self-organization of axial polarity, inside-out layer pattern, and species-specific progenitor dynamics in human ES cell-derived neocortex. Proc. Natl. Acad. Sci. USA110, 20284–20289 (2013). - PMC - PubMed

Publication types

Associated data