. 2024 Dec 19;7(1):293.
doi: 10.1038/s42004-024-01373-2.

Odor prediction of whiskies based on their molecular composition

Affiliations

Odor prediction of whiskies based on their molecular composition

Satnam Singh et al. Commun Chem. .

Abstract

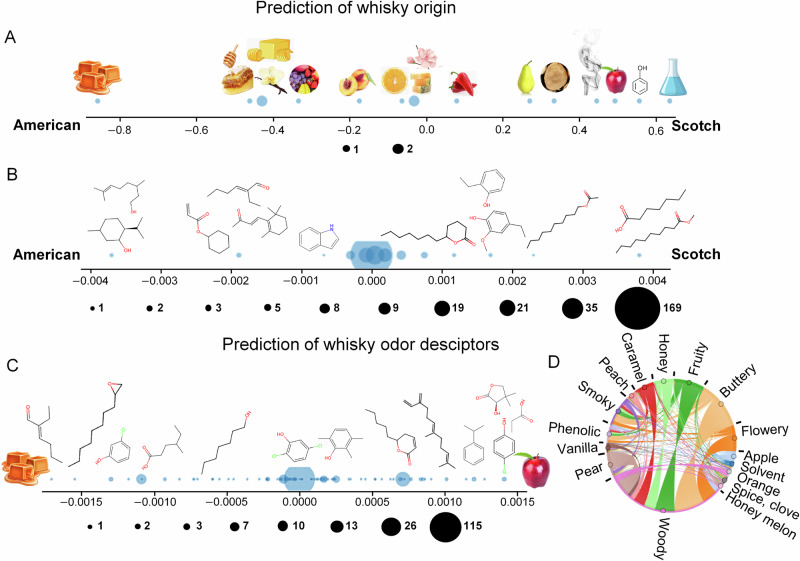
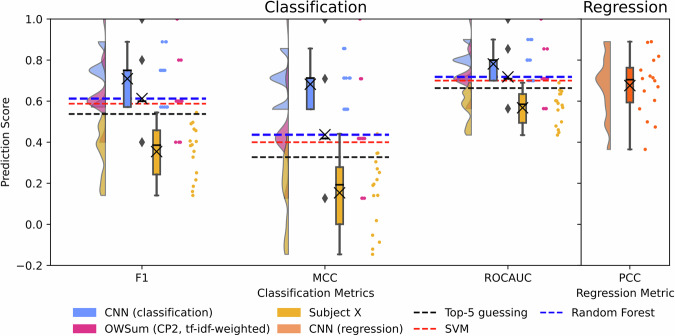
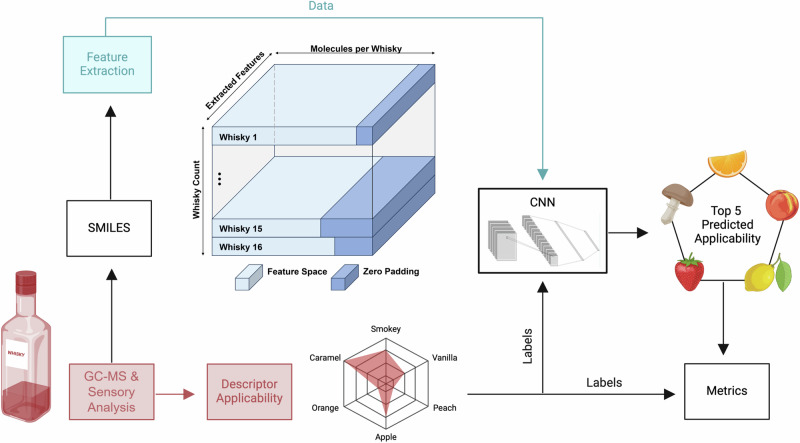
Aroma compositions are usually complex mixtures of odor-active compounds exhibiting diverse molecular structures. Due to chemical interactions of these compounds in the olfactory system, assessing or even predicting the olfactory quality of such mixtures is a difficult task, not only for statistical models, but even for trained assessors. Here, we combine fast automated analytical assessment tools with human sensory data of 11 experienced panelists and machine learning algorithms. Using 16 previously analyzed whisky samples (American or Scotch origin), we apply the linear classifier OWSum to distinguish the samples based on their detected molecules and to gain insights into the key molecular structure characteristics and odor descriptors for sample type. Moreover, we use OWSum and a Convolutional Neural Network (CNN) architecture to classify the five most relevant odor attributes of each sample and predict their sensory scores with promising accuracies (up to F1: 0.71, MCC: 0.68, ROCAUC: 0.78). The predictions outperform the inter-panelist agreement and thus demonstrate previously impossible data-driven sensory assessment in mixtures.


Conflict of interest statement

Competing interests: The authors declare no competing interests.

Figures

Fig. 1
Fig. 1. Insight into feature-class relationships using OWSum.
The x-axis values represent the differences between the influence values of the two respective classes. A Prediction of the whisky type (American vs. Scotch) based on descriptors with same-weighted CP1 OWSum, re-creation accuracy: 93.75%. B Prediction of the whisky type based on molecules with tf-idf-weighted CP1 OWSum, re-creation accuracy: 100%. C Prediction of the odor descriptors of a whisky based on molecules with tf-idf-weighted CP2 OWSum, re-creation accuracy: 96.88%. We show the importance of features for “caramel” vs. “apple”. D Bokeh-diagram of the dissimilarity between descriptors, the arc width displays the pairwise dissimilarity by summing all influence value differences per class (for better visualizing arc width = 1.1^abs(“sum of influence values differences” × 1000)). Dots represent the number of respective descriptors (for A) or molecules (for B, C). We depict some of the molecules as examples. This image was created with resources from Freepik.com.
Fig. 2
Fig. 2. Insight into the evaluation metrics.
Insight into the evaluation metrics using all 16 LOO iterations for CNN pipeline (shown in blue for classification and orange for regression), OWSum (pink) and Subject X (yellow) results using a raincloud plot (code based on ptitprince 0.2.7). For CNN and OWSum, dots represent the respective evaluation metric per LOO iteration and as such per whisky. For Subject X, dots represent the respective evaluation metric per subject, aggregated over all whiskies. Clouds illustrate the data distribution. Crosses in the boxplots depict the mean value of the respective metric, solid black lines within the boxplots the median. Black dashed lines show the metrics for educated guessing, i.e., if the five most occurring descriptors of all but one whisky are predicted for the omitted whisky. Blue dashed lines show the metrics for RF and red dashed lines for SVM. See Table S2 for statistical details. F1 micro F1-Score, ROCAUC Area Under the Receiver Operating Characteristic Curve, MCC micro Matthews Correlation Coefficient, PCC Pearson Correlation Coefficient.
Fig. 3
Fig. 3. Two example molecules, namely, octanoic acid and guaiacol are shown and the maximum common substructure between the two is calculated using RDKit.
The same process is performed for each of the 390 molecules in the reference set. The resulting MCS result is compared to two molecules from the training dataset. The lack of presence of this MCS substructure in the second molecule means that it is assigned an applicability value of zero. This process is then repeated over all MCS substructures, and all molecules detected across each whisky sample to generate the feature applicability matrix shown. Image created with biorender.com.
Fig. 4
Fig. 4. Schematic depiction of the “stack-and-pad” approach for the features extracted per whisky sample for each molecule detected.
The whisky samples are analyzed with sensory analytical approaches to identify the applicable descriptors and molecule SMILES. Using the MCS approach, features are extracted using the training and reference dataset. These features are stacked and zero padded to create a feature cube that is passed into the CNN along with the labels for training and the resulting top-5 descriptors are compared to their ground truths. Image created with biorender.com.

References

    1. Sinha, A. K., Sharma, U. K. & Sharma, N. A comprehensive review on vanilla flavor: extraction, isolation and quantification of vanillin and others constituents. Int. J. Food Sci. Nutr.59, 299–326 (2008). - PubMed
    1. Poisson, L. & Schieberle, P. Characterization of the most odor-active compounds in an American Bourbon whisky by application of the aroma extract dilution analysis. J. Agric. Food Chem.56, 5813–5819 (2008). - PubMed
    1. Jeleń, H. H., Majcher, M. & Szwengiel, A. Key odorants in peated malt whisky and its differentiation from other whisky types using profiling of flavor and volatile compounds. LWT107, 56–63 (2019).
    1. Lee, K.-Y. M., Paterson, A., Piggott, J. R. & Richardson, G. D. Origins of flavour in whiskies and a revised flavour wheel: a review. J. Inst. Brew.107, 287–313 (2001).
    1. Haug, H., Grasskamp, A. T., Singh, S., Strube, A. & Sauerwald, T. Quick insights into whisky—investigating rapid and efficient methods for sensory evaluation and chemical analysis. Anal. Bioanal. Chem.415, 6091–6106 (2023). - PMC - PubMed

LinkOut - more resources