. 2024 Dec 19;7(1):1671.
doi: 10.1038/s42003-024-07309-9.

A miR-219-5p-bmal1b negative feedback loop contributes to circadian regulation in zebrafish

Affiliations

A miR-219-5p-bmal1b negative feedback loop contributes to circadian regulation in zebrafish

Lianxin Wu et al. Commun Biol. .

Abstract

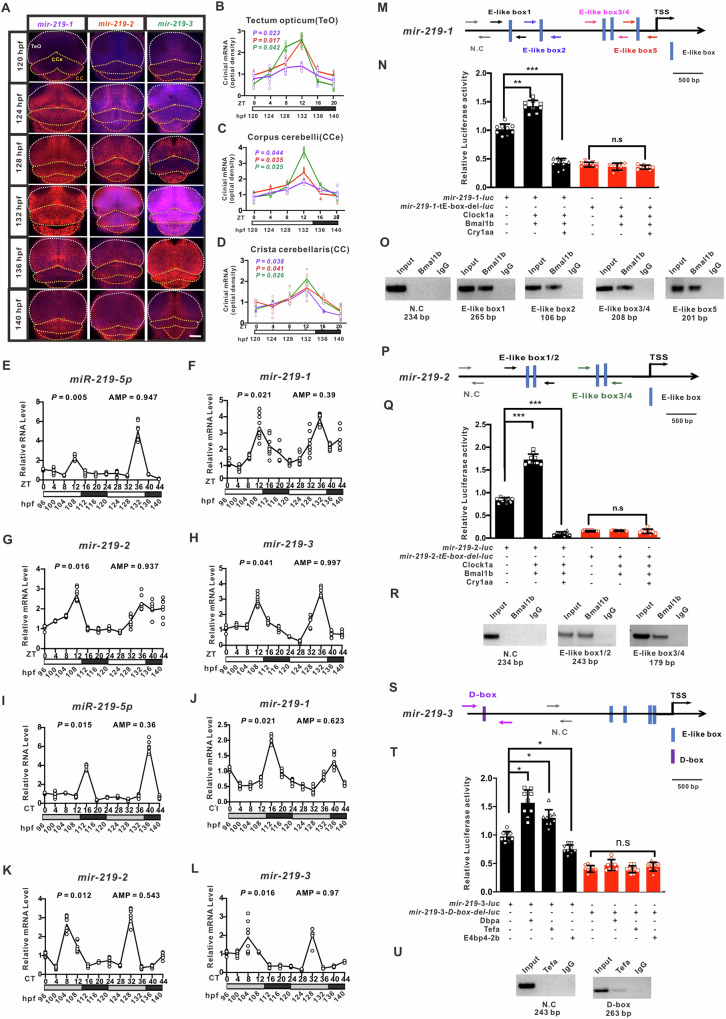
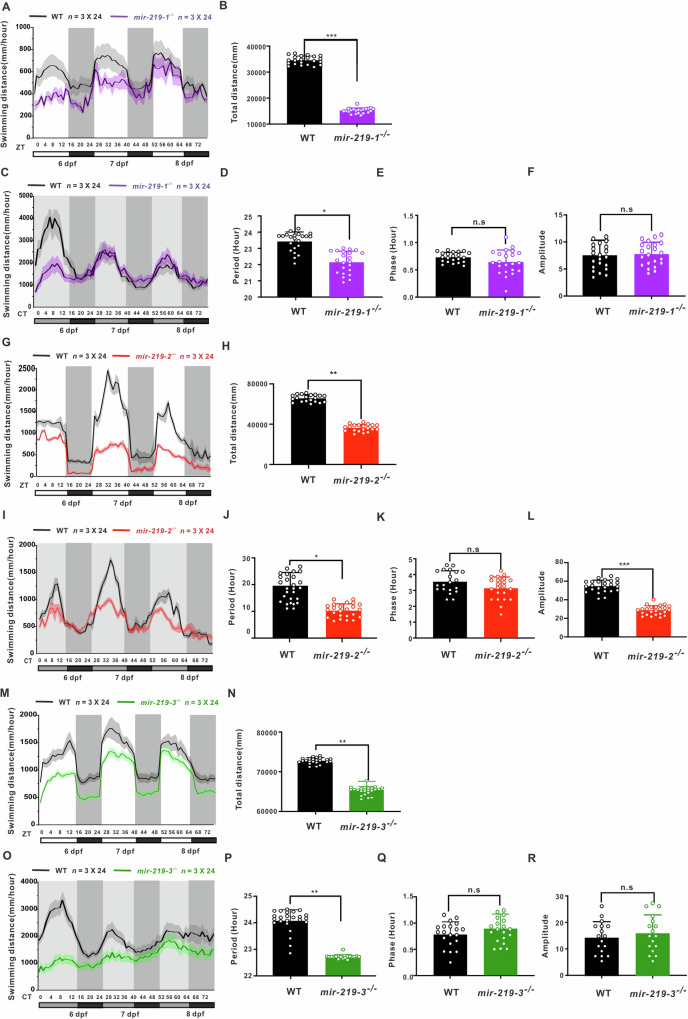
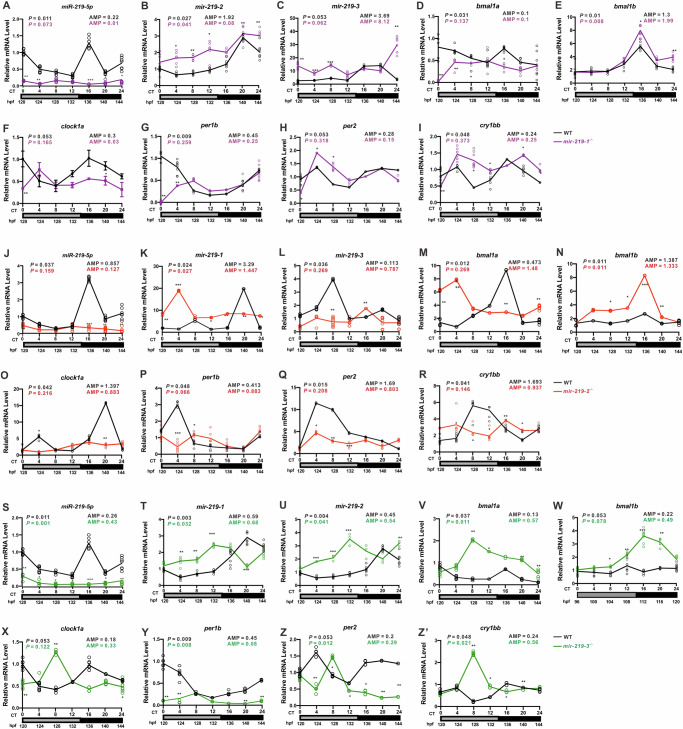
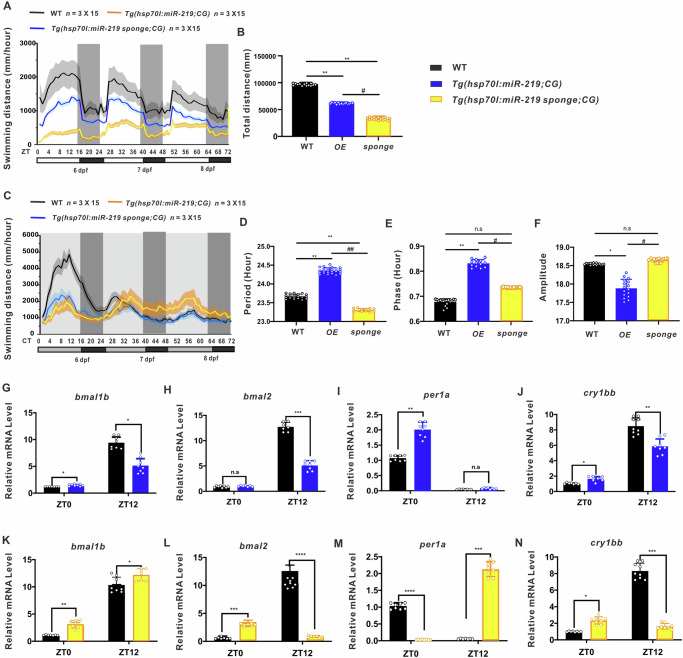
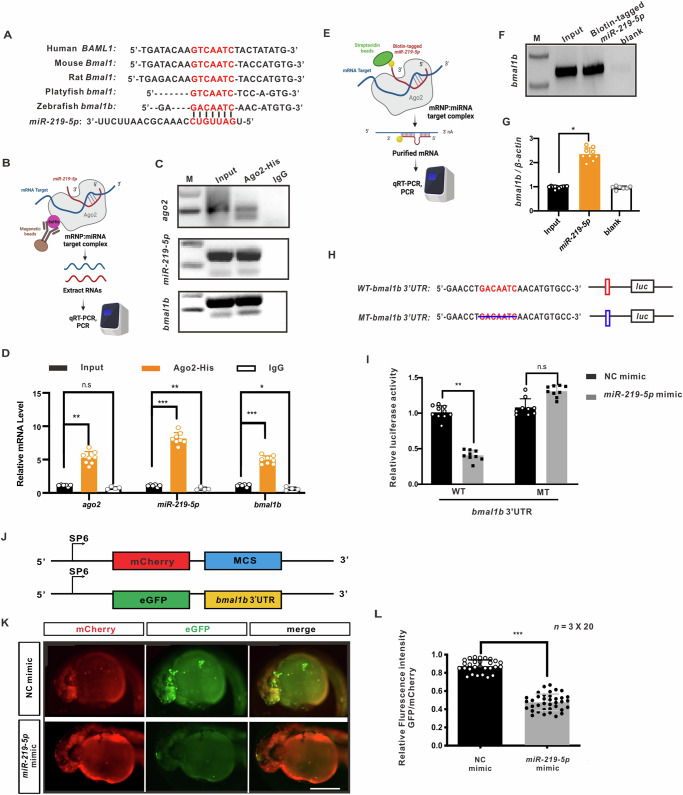
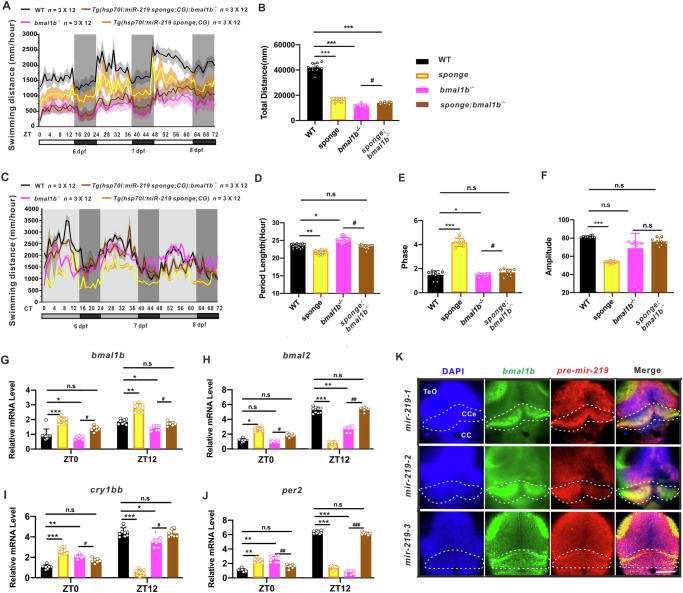
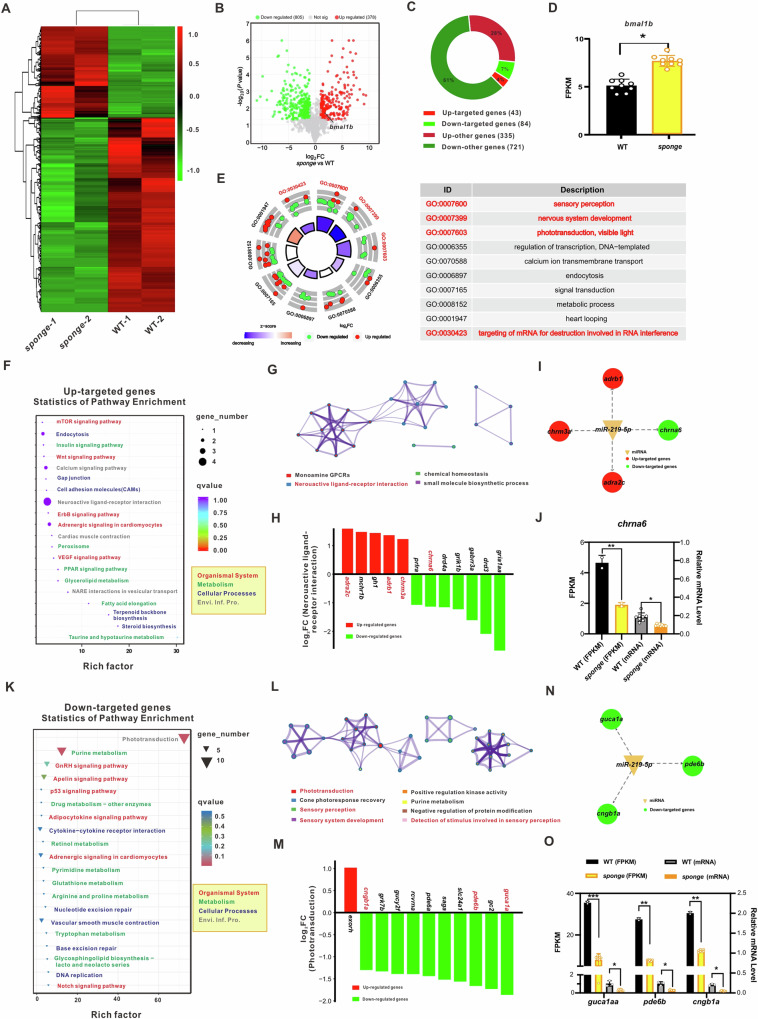
MicroRNAs post-transcriptionally regulate gene expression and contribute to numerous life processes, including circadian rhythms. However, whether miRNAs contribute to zebrafish circadian regulation has not yet been investigated. Here, we showed that mature miR-219-5p, and its three pre-miRNAs, mir-219-1, mir-219-2, and mir-219-3, are rhythmically expressed primarily in Tectum opticum (TeO), Corpus cerebelli (CCe), and Crista cerellaris (CC) of the zebrafish brain. While mir-219-1 and mir-219-2 are regulated by the circadian clock through the E-like box, mir-219-3 is regulated by light via the D-box. Deleting mir-219-1, mir-219-2, or mir-219-3 individually or knocking down miR-219-5p all results in a shortened period of locomotor rhythms and up-regulation of bmal1b. RIP assays with Ago2 and miRNA pull-down assays show that miR-219-5p binds to bmal1b in the RISC. Cell transfection and in Vivo assays show that miR219-5p inhibits bmal1b through binding to its 3'UTR. Further, transcriptome analysis of miR-219-5p knockdown zebrafish adult brain reveals possible roles of miR-219-5p in phototransduction and neuroactive ligand-receptor interaction. Together, our findings demonstrate that mir-219-1, mir-219-2, and mir-219-3 are controlled directly by the circadian clock; and in turn, miR-219-5p contributes to circadian regulation by targeting bmal1b, highlighting a miR-219-5p-bmal1b negative feedback loop in the zebrafish circadian circuit.


Conflict of interest statement

Competing interests: The authors declare no competing interests.

Figures

Fig. 1
Fig. 1. Rhythmically expressed miR-219-5p is regulated by the circadian clock.
A Representative in situ hybridization staining images of pre-mir-219-1 (purple), pre-mir-219-2 (red), and pre-mir-219-3 (green) in zebrafish larvae from 120 to 140 hpf (hours postfertilization) under light-dark (LD), which are expressed primarily in Tectum opticum (TeO) (white), Corpus cerebelli (CCe) (yellow), and Crista cerellaris (CC) (orange). The scale bar is 50 μm. BD Quantification and statistical analysis of in situ hybridization staining images of mir-219-1 (purple), mir-219-2 (red) (C), and mir-219-3 (green) (D) in (A) with ImageJ. Data are mean ± SD. n = 3 × 6. Staining intensities of mir-219-1 (purple), mir-219-2 (red), and mir-219-3 (green) in TeO (B), CCe (C), and CC (D) were analyzed with JTK_CYCLE, P < 0.05 indicates rhythmic expression. Rhythmic expression of mature miR-219-5p (EI), mir-219-1 (F, J), mir-219-2 (G, K), and mir-219-3 (H, L) in zebrafish larvae from 120 to 140 hpf under light-dark (LD) (EH) and constant dark (DD) (IL) conditions, respectively, as shown by qRT-PCR. Data are mean ± SD. n = 6 × 3. JTK_CYCLE was performed, P < 0.05 indicates rhythmic expression. M Diagram of the mir-219-1 promoter containing E-like boxes. The scale bar is 500 bp. N Luciferase reporter assays of E-like boxes in the mir-219-1 promoter. Data are mean ± SD. One-way ANOVA (F = 1.051, P = 0.388) and unpaired two-tailed Student’s t-test and were performed, **P < 0.01, ***P < 0.001 vs. control. O ChIP assays of E-like boxes in the mir-219-1 promoter. P Diagram of the mir-219-2 promoter containing E-like Boxes. The scale bar is 500 bp. Q Luciferase reporter assays of E-like boxes in the mir-219-2 promoter. Data are mean ± SD. One-way ANOVA (F = 9.83, P = 0.197) and unpaired two-tailed Student’s t-test were conducted, *P < 0.05 vs. control. R ChIP assays of E-like Boxes in the mir-219-2 promoter. S Diagram of the mir-219-3 promoter containing D-boxes. The scale bar is 500 bp. T Luciferase reporter assays of D-boxes in the mir-219-3 promoter. Data are mean ± SD. One-way ANOVA (F = 3.68, P = 0.137) and Student’s t-test were performed, *P < 0.05 vs. control. U ChIP assays of D-Boxes in the mir-219-3 promoter. See also Figs. S1 and S2.
Fig. 2
Fig. 2. Altered locomotor activities of mir-219-1−/−, mir-219-2−/−, and mir-219-3−/− zebrafish larvae.
Locomotor activities (A) and total swimming distance of mir-219-1−/− (purple) and wild-type control (black) larvae under LD (B), and locomotor activities (C), period (D), phase (E), and amplitude (F) of mir-219-1−/− (purple) and wild-type control (black) larvae under DD. Data are mean ± SD. n = 3 × 24. Locomotor activities (G) and total swimming distance of mir-219-2−/−(red) and wild-type control (black) larvae under LD (H), and locomotor activities (I), period (J), phase (K), and amplitude (L) of mir-219-2−/−(red) and wild-type control (black) larvae under DD. Data are mean ± SD. n = 3 × 24. Locomotor activities (M) and total swimming distance of mir-219-3−/− (green) and wild-type control (black) larvae under LD (N), and locomotor activities (O), period (P), phase (Q), and amplitude (R) of mir-219-3−/− (green) and wild-type control (black) larvae under DD. Data are mean ± SD. n = 3 × 24. The period, phase and amplitude of its rhythm were analyzed by Classic-JTK and Biodare2. Unpaired two-tailed Student’s t-test was conducted, *P < 0.05, **P < 0.01, ***P < 0.001 vs. WT. See also Figs. S3, S4, and S5.
Fig. 3
Fig. 3. Disrupted expression of circadian clock genes in mir-219-1−/−, mir-219-2−/−, and mir-219-3−/− zebrafish larvae.
Expression of mature miR-219-5p (A), mir-219-2 (B), mir-219-3 (C), bmal1a (D), bmal1b (E), clock1a (F), per1b (G), per2 (H), and cry1bb (I) in the mir-219-1−/− mutant larvae (purple). Data are mean ± SD. n = 3 × 3. Expression of mature miR-219-5p (J), mir-219-1 (K), mir-219-3 (L), bmal1a (M), bmal1b (N), clock1a (O), per1b (P), per2 (Q), and cry1bb (R) in the mir-219-2−/− mutant larvae (red). Data are mean ± SD. n = 3 × 3. Expression of mature miR-219-5p (S), mir-219-1 (T), mir-219-2 (U), bmal1a (V), bmal1b (W), clock1a (X), per1b (Y), per2 (Z), and cry1bb (Z’) in the mir-219-3−/− mutant larvae (green). Data are mean ± SD. n = 3 × 3. JTK_CYCLE was performed, P < 0.05 indicates rhythmic expression. Two-way ANOVA with the Tukey post hoc test was conducted, *P < 0.05, **P < 0.01, ***P < 0.001 vs. WT.
Fig. 4
Fig. 4. Disrupted rhythmicity of locomotor activities and expression of circadian clock genes in heat shock-inducible miR-219-5p overexpression or knockdown zebrafish larvae.
Locomotor activities (A) and total swimming distance (B) of Tg(hsp70l:miR-219-5p;CG2) (OE) (blue), Tg(hsp70l:miR-219-5p sponge;CG2) (sponge) (yellow), and WT control (black) larvae under LD conditions. Data are mean ± SD. n = 3 × 15. Unpaired two-tailed Student’s t-test was performed, *P < 0.05, **P < 0.01, ***P < 0.001 vs. WT; #P < 0.05, ##P < 0.01 vs. Tg(hsp70l:miR-219-5p;CG2). Locomotor activities (C), period (D), phase (E), and amplitude (F) of Tg(hsp70l:miR-219-5p;CG2) (OE) (blue),Tg(hsp70l:miR-219 sponge;CG2) (sponge) (yellow), and WT control (black) larvae under DD conditions. Data are mean ± SD. n = 3 × 15. Unpaired two-tailed Student’s t-test was performed, *P < 0.05, **P < 0.01, ***P < 0.001 vs. WT; #P < 0.05, ##P < 0.01 vs. Tg(hsp70l:miR-219-5p;CG2). Expression of circadian clock genes bmal1b (G, K), bmal2 (H, L), per1a (I, M), and cry1bb (J, N) in Tg(hsp70l:miR-219-5p;CG2) (blue), Tg(hsp70l:miR-219 sponge;CG2) (yellow), and WT (black) larvae at 120 hpf/ZT0 and 132 hpf/ ZT12, as shown by qRT-PCR. Data are mean ± SD. n = 3 × 3. Unpaired two-tailed Student’s t-test was performed, *P < 0.05, **P < 0.01, ***P < 0.001 vs. WT. See also Figs. S7, S8, and S9.
Fig. 5
Fig. 5. bmal1b is the target of miR-219-5p.
A The binding site (red) of miR-219-5p in the zebrafish bmal1b 3’UTR. Those of BMAL1/Bmal1 of humans, mice, and rats have one mismatch at the second position. B Schematic diagram of the RNA-binding protein immunoprecipitation (RIP) by Ago2-His, created in BioRender (https://BioRender.com/b76b549). Electrophoretic (C) and qRT-PCR (D) analyses of RIP show that both miR-219-5p and bmal1b are present in the RISC pulled down by Ago2. Data are mean ± SD. n = 3. Unpaired two-tailed Student’s t-test was performed, *P < 0.05, **P < 0.01, ***P < 0.001 vs. Input. E Schematic diagram of the miRNA pull-down by 3’Biotin-tagged miR-219-5p, created in BioRender (https://BioRender.com/b76b549). Electrophoretic (F) and qRT-PCR (G) analyses of miRNA pull-down show that miR-219-5p binds to bmal1b. Data are mean ± SD. n = 3. Unpaired two-tailed Student’s t-test was performed, *P < 0.05 vs. Input. H, I Luciferase reporter assays show that miR-219-5p inhibits bmal1b. Construction of the plasmids of the bmal1b 3’UTR fused with luciferase (WT) and the mutated bmal1b 3’UTR with the deleted miR-219-5p binding site, fused with luciferase (MT) (H). Luciferase assays with NC mimic and miR-219-5p mimic show that miR-219-5p inhibits bmal1b (I). Data are mean ± SD. n = 3 × 3. Unpaired two-tailed Student’s t-test was performed, **P < 0.01 vs. NC mimic. JL In Vivo assays confirm miR-219-5p inhibits bmal1b. Construction of plasmids of pCS2-EGFP-bmal1b-3’UTR and pCS2-mCherry-MCS control plasmids (J). Images of representative embryos injected with CS2-EGFP-bmal1b-3’UTR or pCS2-mCherry-MCS control plasmids, and miR-219-5p mimic or NC mimic (K). Quantification and statistical analysis of the ratio of GFP and mCherry with ImageJ (L). The scale bar is 100 μm. Data are mean ± SD. n = 3 × 5. Unpaired two-tailed Student’s t-test was performed, ***P < 0.001 vs NC mimic. See also Fig. S6.
Fig. 6
Fig. 6. Loss of Bmal1b restores the circadian rhythm of Tg (hsp70l: miR-219 sponge; CG2) zebrafish larvae.
Locomotor activities (A) and total swimming distances (B) of Tg(hsp70l:miR-219-5p sponge;CG2) (sponge) (yellow), bmal1b−/− (magenta), Tg(hsp70l:miR-219 sponge;CG2);bmal1b−/− (brown), and WT control (black) larvae under LD conditions. Data are mean ± SD. n = 3 × 12. Locomotor activities (C), period (D), phase (E), and amplitude (F) of Tg(hsp70l:miR-219 sponge;CG2) (sponge) (yellow), bmal1b−/− (magenta), Tg(hsp70l:miR-219 sponge;CG2);bmal1b−/− (brown), and WT control (black) larvae under DD conditions. Data are mean ± SD. n = 3 × 12. Expression of circadian clock genes bmal1b (G), bmal2 (H), per2 (J), and cry1bb (I) in Tg(hsp70l:miR-219 sponge;CG2) (sponge) (yellow), bmal1b−/− (magenta), Tg(hsp70l:miR-219 sponge;CG2);bmal1b−/− (brown), and WT (black) control larvae under DD conditions, as shown by qRT-PCR. Data are mean ± SD. n = 3 × 3. Unpaired two-tailed Student’s t-test was performed, *P < 0.05, **P < 0.01, *** P < 0.001 vs. WT; #P < 0.05, ##P < 0.01, ### P < 0.001 vs. bmal1b−/−. K Co-localization of bmal1b (green) with mir-219-1 (red), mir-219-2 (red), and mir-219-3 (red), primarily in Tectum opticum (TeO) (white), Corpus cerebelli (CCe) (yellow) and Crista cerellaris (CC)(orange), respectively, as shown by two-color FISH. The scale bar is 50 μm. n = 3 × 6. See also Fig. S10.
Fig. 7
Fig. 7. Transcriptome analysis of the adult brains of Tg(hsp70l:miR-219 sponge;CG2) zebrafish.
The heatmap (A) and volcano plot (B) show 805 down-regulated genes (green) and 378 up-regulated genes (red) in adult brains of Tg(hsp70l:miR-219 sponge;CG2) zebrafish (sponge). Among them, bmal1b, a target gene of miR-219-5p, is an upregulated gene. C Donut chart displays the classification of differentially expressed genes (DEGs) as miR-219-5p targeted genes that contain the target sequence in their 5’UTR and miR-219-5p non-targeted genes without the target sequence in their 5’UTR, including 43 (4%) up-regulated targeted genes (red), 84 (7%) down-regulated targeted genes (green), 335 (28%) other up-regulated genes (crimson), and 721 (61%) other down-regulated genes (dark green). D Expression of bmal1b in the brains of Tg(hsp70l:miR-219 sponge;CG2) (yellow) and WT (black), determined by FPKM. E GO circle of miR-219-5p up-regulated and down-regulated targeted genes in terms of Biological Process (BP). F, G KEGG enrichment analysis and Metascape illustration (G) of miR-219-5p up-regulated target genes. H Bar plots of up-regulated genes (red) and down-regulated genes (green) involved in the neuroactive ligand-receptor interaction pathway. miR-219-5p targeted genes are in red. I The miRNA-mRNA target network for the neuroactive ligand-receptor interaction pathway. Shown are miR-219-5p (orange triangle), Up-targeted genes (red circle), and Down-targeted genes (green circles). J Expression of chrna6 in the brains of Tg(hsp70l:miR-219 sponge;CG2) (FPKM) (yellow), WT (FPKM) (black), Tg(hsp70l:miR-219 sponge;CG2) (mRNA) (orange) and WT (mRNA) (gray), determined by FPKM and qRT-PCR. Data are mean ± SD. n = 3 × 3. Unpaired two-tailed Student’s t-test was performed, *P < 0.05, **P < 0.01 vs. WT. K, L KEGG enrichment analysis and Metascape illustration (L) of miR-219-5p down-regulated targeted genes. M Bar plots of up-regulated genes (red) and down-regulated genes (green) involved in phototransduction. miR-219-5p targeted genes are in red. N The miRNA-mRNA target network for phototransduction. Shown are miR-219-5p (orange triangle) and Down-targeted genes (green circle). O Expression of guca1aa, pde6b, and cngb1a in the brains of Tg(hsp70l:miR-219 sponge;CG2) (FPKM) (yellow), WT (FPKM) (black), Tg(hsp70l:miR-219 sponge;CG2) (mRNA) (orange) and WT (mRNA) (gray), determined by FPKM and qRT-PCR. Data are mean ± SD. n = 3 × 3. Unpaired two-tailed Student’s t-test was performed, *P < 0.05, **P < 0.01, *** P < 0.001 vs. WT. See also Fig. S11.

References

    1. Pittendrigh, C. S. Temporal organization: reflections of a Darwinian clock-watcher. Annu. Rev. Physiol.55, 16–54 (1993). - PubMed
    1. Bell-Pedersen, D. et al. Circadian rhythms from multiple oscillators: lessons from diverse organisms. Nat. Rev. Genet.6, 544–556 (2005). - PMC - PubMed
    1. Panda, S., Hogenesch, J. B. & Kay, S. A. Circadian rhythms from flies to human. Nature417, 329–335 (2002). - PubMed
    1. Bass, J. & Lazar, M. A. Circadian time signatures of fitness and disease. Science354, 994–999 (2016). - PubMed
    1. Panda, S. Circadian physiology of metabolism. Science354, 1008–1015 (2016). - PMC - PubMed

MeSH terms

LinkOut - more resources