. 2024 Dec 19;7(1):1659.
doi: 10.1038/s42003-024-07343-7.

Single-cell dissection of multifocal bladder cancer reveals malignant and immune cells variation between primary and recurrent tumor lesions

Affiliations

Single-cell dissection of multifocal bladder cancer reveals malignant and immune cells variation between primary and recurrent tumor lesions

Shenghua Liu et al. Commun Biol. .

Abstract

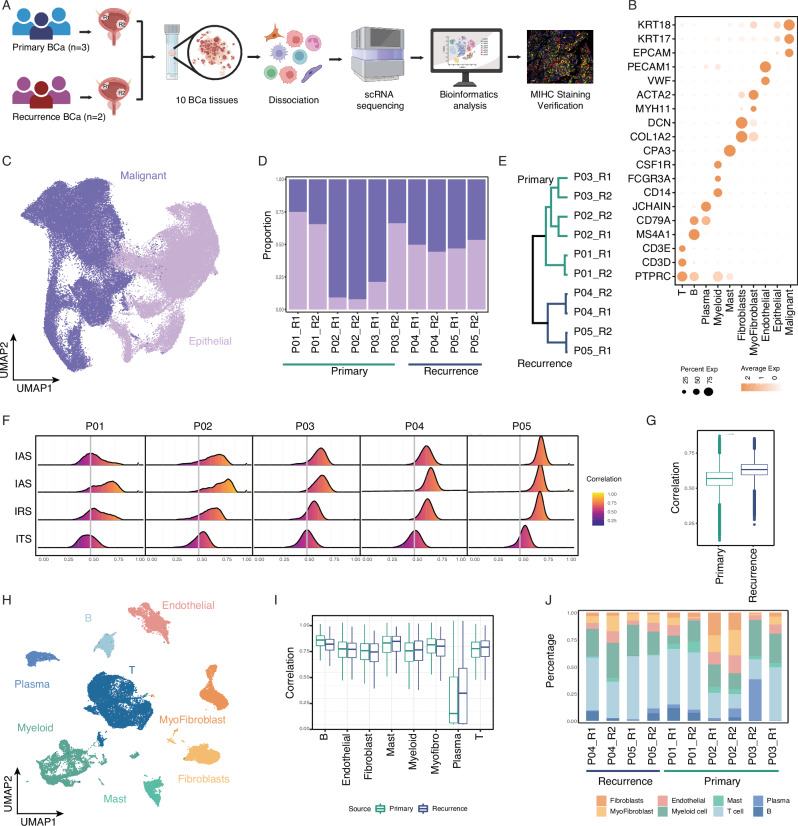
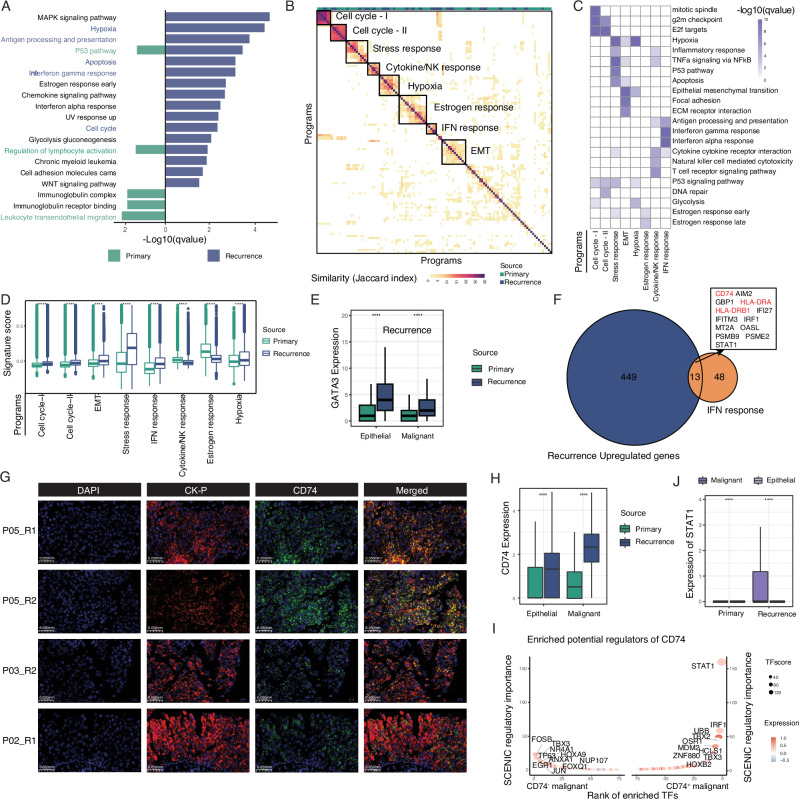
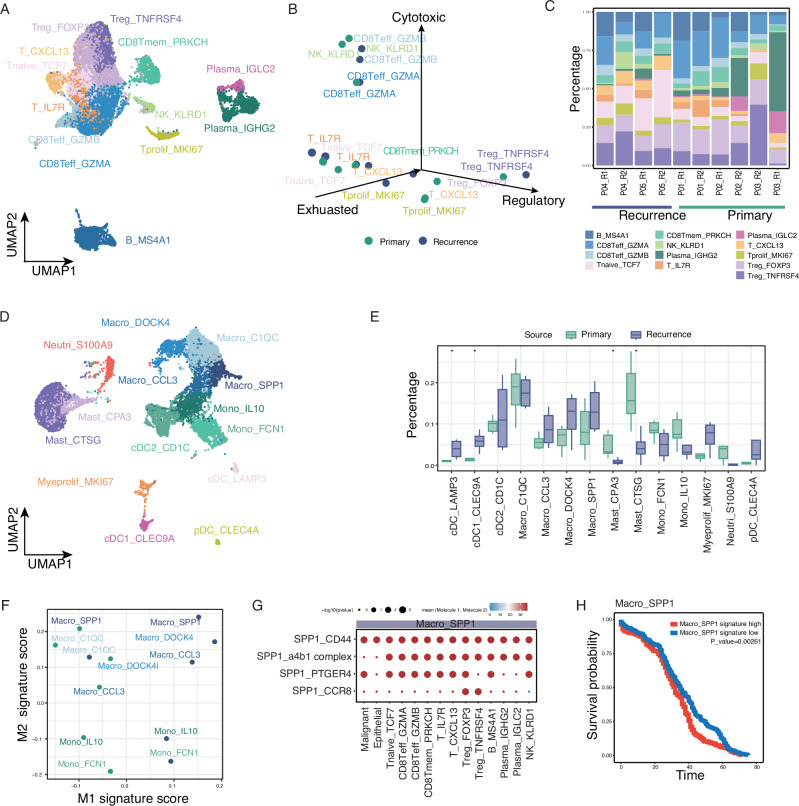
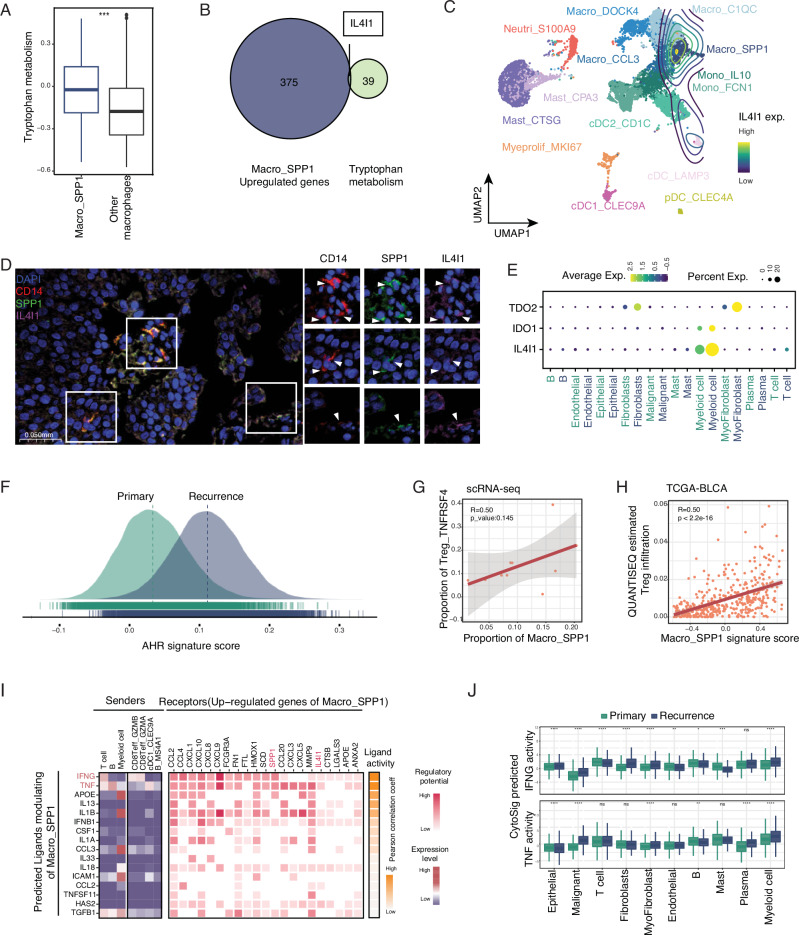
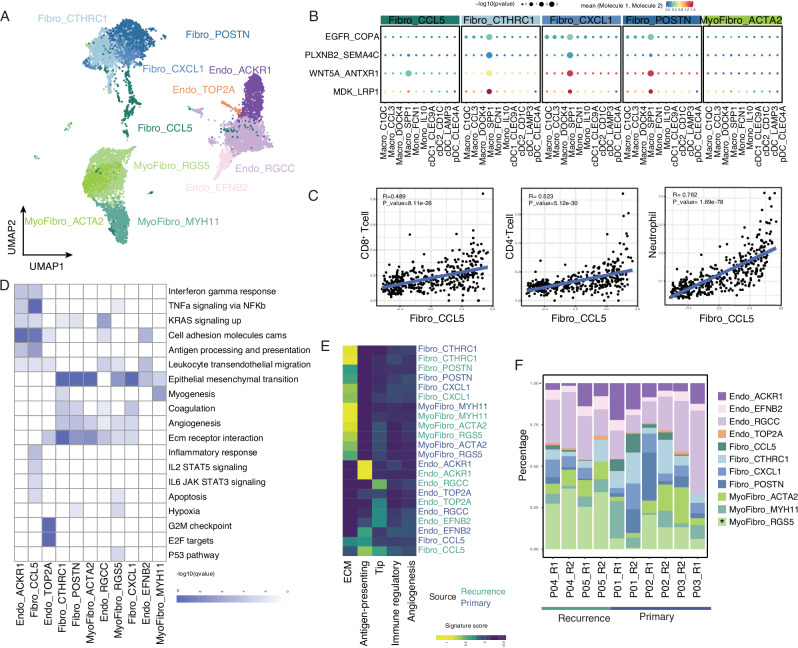
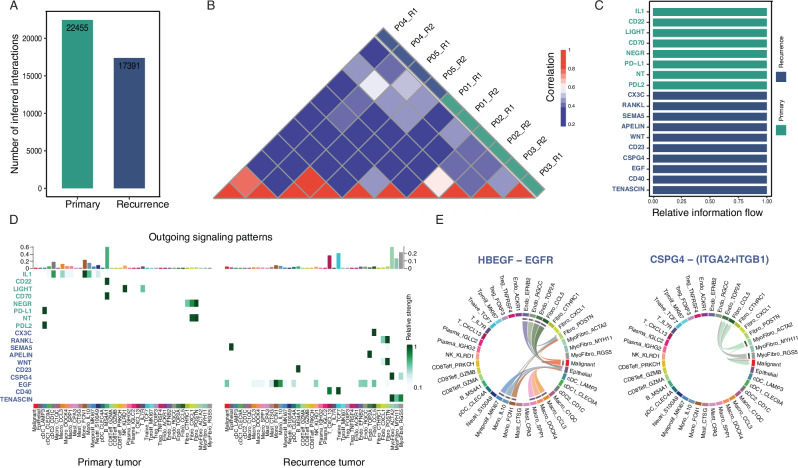
Bladder carcinoma (BLCA) is characterized by a high rate of post-surgery recurrence and multifocality. Multifocal tumors have a higher risk of recurrence compared to single tumors, significantly impacting bladder cancer-specific mortality. However, the interregional or intraregional heterogeneity within both primary and recurrent tumors remains poorly understood. Here, we employed single-cell RNA sequencing to analyze tumor lesions from five multifocal bladder cancer patients comprising three primary tumors and two recurrent tumors. Our findings revealed that malignant cells derived from recurrent multifocal bladder cancer exhibited higher interregional transcriptional similarity and consistent cellular communication. Furthermore, our analysis uncovered that malignant cells from recurrent tumors may evade immune destruction by suppressing cytokine responses and natural killer cell activity. Notably, we identified a preference for the expression of the tryptophan metabolic enzyme IL4I1 on SPP1+ macrophages in recurrent tumors. Functional analyses have revealed that IL4I1 may promotes tumor progression in recurrent tumors by activating the aryl hydrocarbon receptor (AHR) and recruiting regulatory T cells to suppress adaptive immunity. Taken together, our study provides a comprehensive understanding of primary and recurrent multifocal bladder tumors, offering valuable resources for analyzing the multifocality and recurrence of bladder cancer.


Conflict of interest statement

Competing interests: The authors declare no competing interests. Ethics approval and consent to participate: Informed consent was obtained for all patients and the study was approved by Shanghai Tenth People’s Hospital (22KN209).

Figures

Fig. 1
Fig. 1. Multilesional single-cell transcriptome profiling of primary and recurrent bladder cancer.
A Workflow of multilesional tumor tissue collection, processing, scRNA-seq, and data analysis, Image created with BioRender.com, with permission. B Heatmap shows the marker genes expression of all cell types. C Uniform manifold approximation and projection (UMAP) plots of all malignant and epithelial cells, colored by the cell type annotation. D Histogram indicating the proportion of cells in each sample. E Hierarchical clustering of malignant cells from each tumor lesion across all samples. F The distribution of pair-wise correlations of malignant cells within each tumor lesion (intraregion), across tumor lesions within each patient (interregion) and across patients (intertumor). Pearson’s correlation coefficient was applied. Solid and dashed gray lines indicate the mean and standard deviation of all intraregional correlation values. G Boxplot showing the correlation of malignant cells across tumor lesions within patients. H UMAP of non-malignant cells, colored by cell type. I Boxplot showing the correlation of each cell type cells across tumor lesions within patients. J Histogram indicating the proportion of each cell type in each sample.
Fig. 2
Fig. 2. Deciphering expression programs revealed the epithelial-immune dual feature of malignant cells in recurrent tumors.
A Two-sided bar graph showing the enriched pathways in primary and recurrent tumor-derived malignant cells. B Hierarchical clustering of intra-tumor expression programs, defined by Non-negative factorization (NMF), to identify the meta-programs based on the Jaccard index. C Heatmap showing the enriched pathways for each meta-program. D Boxplot showing the signature scores of meta-programs among malignant cells from primary and recurrent tumors. E Boxplot showing the expression of GATA3 in malignant cells from primary and recurrent tumors. F Venn diagram illustrating the shared genes between IFN response-associated genes and the upregulated gene of recurrent tumor-derived malignant cells. G Immunofluorescence images showing the localization of CD74 and the malignant cells marker gene CK-P in recurrent bladder tumors. Scale bar, 0.05 mm. H Boxplot showing the expression of CD74 across epithelial and malignant cells. I The rank of driver transcription regulators in the CD74+ and CD74- malignant cells. The regulators are ranked by the regulatory importance from the SCENIC result. J Boxplot showing the expression of STAT1 in epithelial and malignant cells.
Fig. 3
Fig. 3. Immune cell heterogeneity of primary and recurrent bladder tumors.
A UMAP visualization of the distribution of lymphocytes, colored by cell types. B Scatter plot showing the cytotoxic, exhausted, and regulatory signature score for each lymphocyte. C Histogram indicating the proportion of each cell type in each sample. D UMAP visualization of the distribution of myeloid cells, colored by cell types. E Boxplot showing the infiltration levels of each cell type in primary and recurrent tumors. F Scatter plot showing the M1/2 polarization of all macrophages and monocytes. G Bubble heatmap showing the interaction strength of gene pairs between macrophage and other cell types. These scores are normalized expression levels, and the sizes of the bubbles indicate the significance of the interactions, calculated by CellPhoneDB. H Kaplan–Meier curves showing the clinical effect of SPP1+ macrophages in public NMIBC dataset.
Fig. 4
Fig. 4. IL4I1 activates the aryl hydrocarbon receptor (AHR) and suppresses adaptive immunity.
A Boxplot showing the activity of tryptophan metabolism in SPP1+ macrophages and other macrophages. B Venn diagram illustrating the shared genes between Tryptophan metabolism-associated genes and the SPP1+ macrophage upregulated genes. C Contour line delineating expression of IL41 on myeloid cells. D Immunofluorescence images showing the colocalization of CD14, SPP1, and IL4I1. Scale bar, 0.05 mm. E Dot plot depicting the expression of tryptophan metabolism-associated enzymes across all cell types. F Density plot illustrating the AHR signature score between malignant cells from primary and recurrent tumors. G Dot plot showing the correlation between the proportion of SPP1+ macrophage and TNFRSF4+ regulatory T cells. H Dot plot showing the correlation between the signature score of SPP1+ macrophages and infiltrated regulatory T cells in the TCGA BLCA cohort. I Top ligands inferred to regulate the SPP1+ macrophage according to NicheNet (middle). Heatmap showing the expression of ligands mentioned in the middle panel across cell types (left). Ligands ranked by the Pearson correlation (right). J Boxplot showing the CytoSig predicted TNFA and IFNG activities between primary and recurrent tumors (ns, not significant; *P < 0.05; **P < 0.01; ***P < 0.001; ****P < 0.0001).
Fig. 5
Fig. 5. Stromal cell heterogeneity of primary and recurrent bladder tumors.
A UMAP visualization of the distribution of stromal cells, colored by cell types. B Bubble heatmap showing the interaction strength of gene pairs between myeloid cells and fibroblast cells. C Dot plot showing the correlation between the estimated immune cell infiltration and the signature score of CCL5+ fibroblast cells. D Heatmap showing the enriched pathways for each stromal cell type. E Heatmap showing different expression patterns of function-associated signature genes among all stromal cell types. F Histogram indicating the proportion of each cell type in each sample.
Fig. 6
Fig. 6. Communication of malignant cells and non-malignant cells.
A Bar plot showing the number of inferred interactions in primary and recurrent tumors. B Similarity of ligand-receptor interactions among tumor lesions of different patients. Zero indicates no overlap of ligand-receptor interactions while 1 means a full overlap of ligand–receptor interactions between samples. C Stacked histograms of the significant pathways were ranked based on differences in the overall information flow within the inferred networks between primary and recurrent tumor samples. D Heatmap showing the outgoing signaling patterns of source-specific interaction pathways among all cell types. E Circos plots showing signaling interaction between malignant and non-malignant cells in recurrent tumors.

References

    1. Siegel, R. L., Miller, K. D., Wagle, N. S. & Jemal, A. Cancer statistics, 2023. CA Cancer J. Clin.73, 17–48 (2023). - PubMed
    1. Wu, C.-H., Silvers, C. R., Messing, E. M. & Lee, Y.-F. Bladder cancer extracellular vesicles drive tumorigenesis by inducing the unfolded protein response in endoplasmic reticulum of nonmalignant cells. J. Biol. Chem.294, 3207–3218 (2019). - PMC - PubMed
    1. Acar, Ö. et al. Determining the origin of synchronous multifocal bladder cancer by exome sequencing. BMC Cancer15, 871 (2015). - PMC - PubMed
    1. Tan, Z. et al. Comprehensive analysis of scRNA-Seq and bulk RNA-Seq reveals dynamic changes in the tumor immune microenvironment of bladder cancer and establishes a prognostic model. J. Transl. Med.21, 223 (2023). - PMC - PubMed
    1. Jones, T. D. et al. Molecular evidence supporting field effect in urothelial carcinogenesis. Clin. Cancer Res.11, 6512–6519 (2005). - PubMed