. 2024 Dec 19;9(1):39.
doi: 10.1038/s41536-024-00383-x.

Myoblast-derived ADAMTS-like 2 promotes skeletal muscle regeneration after injury

Affiliations

Myoblast-derived ADAMTS-like 2 promotes skeletal muscle regeneration after injury

Nandaraj Taye et al. NPJ Regen Med. .

Abstract

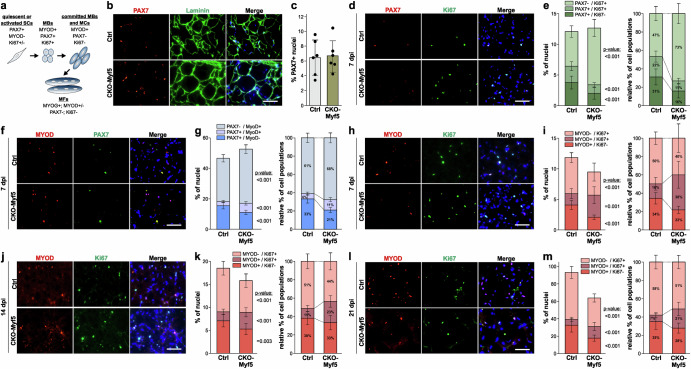
Skeletal muscle regeneration and functional recovery after minor injuries requires the activation of muscle-resident myogenic muscle stem cells (i.e. satellite cells) and their subsequent differentiation into myoblasts, myocytes, and ultimately myofibers. We recently identified secreted ADAMTS-like 2 (ADAMTSL2) as a pro-myogenic regulator of muscle development, where it promoted myoblast differentiation. Since myoblast differentiation is a key process in skeletal muscle regeneration, we here examined the role of ADAMTSL2 during muscle regeneration after BaCl2 injury. Specifically, we found that muscle regeneration was delayed after ablation of ADAMTSL2 in myogenic precursor cells and accelerated following injection of pro-myogenic ADAMTSL2 protein domains. Mechanistically, ADAMTSL2 regulated the number of committed myoblasts, which are the precursors for myocytes and regenerating myofibers. Collectively, our data support a role for myoblast-derived ADAMTSL2 as a positive regulator of muscle regeneration and provide a proof-of-concept for potential therapeutic applications.


Conflict of interest statement

Competing interests: The authors declare no competing interests.

Figures

Fig. 1
Fig. 1. Spatiotemporal regulation of ADAMTSL2 during muscle regeneration.
a Experimental design for BaCl2 injury in wild type (WT) mice. b, c Representative images of cross-sections of uninjured control (Ctrl) and injured tibialis anterior (TA) muscles at 7 (b) and 14 days post injury (dpi) (c). Sections were stained for ADAMTSL2 (red) and laminin (green). Nuclei were stained with DAPI (blue). d Quantification of ADAMTSL2 mean fluorescence intensity at 7 and 14 dpi (n = 6 mice, 1-2 fields-of-view). e Quantification of myofiber cross-sectional area (CSA) at 7 and 14 dpi (n = 6 mice, number of myofibers indicated). f Western blot detection of ADAMTSL2 and GAPDH in Ctrl and injured TA muscle extracts at 7 and 14 dpi. g Quantification of fluorescence intensities of ADAMTSL2 bands normalized to GAPDH (n = 3-4 mice). h qRT-PCR quantification of Adamtsl2 mRNA at 4 and 14 dpi normalized to Gapdh (n = 3 mice). i Representative images of TA muscles cross-sections of 8-week-old D2 Ctrl and D2.mdx mice. Sections were stained for ADAMTSL2 (red) and laminin (green). Nuclei were stained with DAPI (blue). j Quantification of ADAMTSL2 mean fluorescence intensities from D2 and D2.mdx TA muscles (n = 3 mice). k qRT-PCR quantification of Adamtsl2 mRNA normalized to Gapdh (n = 4 mice). l Analysis of muscle regeneration after cardiotoxin injury. The percentage of positive cells per gene is shown. Total number of analyzed cells/time point: 0 = 5670, 0.5 dpi = 3510, 2 dpi = 8395, 3.5 dpi = 11251, 5 dpi = 9491, 10 dpi = 6214, 21 dpi = 8662. m, n Expression levels of Adamtsl2 (m) and Pax7 (n) after cardiotoxin injury. Data points represent normalized and scaled mRNA levels from individual cells. Cells with an expression value of 0 are not shown. Bars in d, g, h, j, k represent mean values and whiskers the standard deviation. Boxes in m, n represent 25th – 50th percentile range, whiskers in e, m, n the standard deviation, and horizontal lines the mean value. Statistical significance in d, e, g, h, j, k was calculated using a Student’s t test and in m, n using a one-way ANOVA with posthoc Tukey test. Scale bars in b, c, i = 50 μm. Graphs were generated using CorelDRAW and OriginPro.
Fig. 2
Fig. 2. ADAMTSL2 deletion in Myf5-positive myogenic precursor cells (CKO-Myf5) delayed muscle regeneration after BaCl2 injury.
a Experimental design for BaCl2 injury in CKO-Myf5 mice. b Representative images of cross-sections of inured control (Ctrl, Adamtsl2flox/flox) and CKO-Myf5 (Adamtsl2flox/flox;Myf5-Cre) TA muscles at 7 dpi. Sections were stained for eMyHC (red) and laminin (green). Nuclei were stained with DAPI (blue). c Quantification of myofiber CSA at 7 dpi (n = 6 mice, number of measured myofibers indicated). d Quantification of eMyHC mean fluorescence intensity at 7 dpi (n = 6 mice, 1-2 fields-of-view). e Representative images of cross-sections of inured Ctrl and CKO-Myf5 TA muscles at 14 dpi. Sections were stained for eMyHC (red) and laminin (green). Nuclei were stained with DAPI (blue). f Quantification of myofiber CSA at 14 dpi (n = 6 mice, number of measured myofibers indicated). g Quantification of eMyHC mean fluorescence intensity at 14 dpi (n = 6 mice, 1-2 fields-of-view). h Representative images of cross-sections of injured Ctrl and CKO-Myf5 TA muscles at 21 dpi. Sections were stained for eMyHC (red) and laminin (green). Nuclei were stained with DAPI (blue). i Quantification of myofiber CSA at 21 dpi (n = 5 mice, number of measured myofibers indicated). j Quantification of eMyHC mean fluorescence intensity at 21 dpi (n = 5 mice, 2 fields-of-view/muscle). k Experimental design for tamoxifen-induced Adamtsl2 ablation in CKO-Rosa mice. l Representative images of cross-sections of injured Ctrl (Adamtsl2flox/flox) and CKO-Rosa (Adamtsl2flox/flox;Rosa-CreERT) TA muscles at 14 dpi. Sections were stained for ADAMTSL2 (red) and laminin (green). Nuclei were stained with DAPI (blue). m Quantification of myofiber CSA at 14 dpi (n = 3 mice, number of measured myofibers indicated). n Quantification of eMyHC mean fluorescence intensity at 14 dpi (n = 3 mice). Bars in d, g, j, n represent mean values, whiskers the standard deviation. Lines in c, f, i, m represent mean values, and whiskers the standard deviation. Statistical significance in c, d, f, g, i, j, m, n was calculated using a Student’s t-test. Scale bars in b, e, h, l = 100 μm. Graphs were generated using CorelDRAW and OriginPro.
Fig. 3
Fig. 3. ADAMTSL2-deficiency in myogenic precursor cells delays myoblast differentiation during muscle regeneration.
a Cell populations and marker genes during myogenic differentiation. SCs, satellite cells; MBs, myoblasts; MCs, myocytes; MFs, myofibers. b Representative images of cross-sections of uninjured control (Ctrl) and CKO-Myf5 TA stained for PAX7 (red), laminin (green), and nuclei (blue). c Quantification of percentage of PAX7+ nuclei (n = 3, 2 fields-of-view). d Representative images of cross-sections of injured Ctrl or CKO-Myf5 TA at 7 dpi stained for PAX7 (red), Ki67 (green), and nuclei (blue). e Bar graphs representing PAX7+/Ki67+ and PAX7+/Ki67- muscle stem cells as percentage of total nuclei (left) and relative to each other (right) (n = 6 mice, 2-fields-of-view). f Representative images of cross-sections of injured Ctrl or CKO-Myf5 TA at 7 dpi stained for MyoD (red), PAX7 (green), and nuclei (blue). g Bar graphs representing PAX7-/MYOD+, PAX7+/MYOD-, and PAX7+/MYOD- cells as percentage of total nuclei (left) and relative to each other (right) (n = 6 mice, 2 fields-of-view). h Representative images of cross-sections of injured Ctrl or CKO-Myf5 TA at 7 dpi stained for MYOD (red), Ki67 (green), and nuclei (blue). i Bar graphs representing MYOD+/Ki67+ and MYOD+/Ki67- myoblasts as percentage of total nuclei (left) and relative to each other (right) (n = 6 mice, 2 fields-of-view). j Representative images of cross-sections of injured Ctrl or CKO-Myf5 TA at 14 dpi stained for MYOD (red), Ki67 (green), and nuclei (blue). k Bar graphs representing MYOD+/Ki67+ and MYOD+/Ki67- myoblasts as percentage of total nuclei (left) and relative to each other (right) (n = 6 mice, 2 fields-of-view). l Representative images of cross-sections of injured Ctrl or CKO-Myf5 TA at 21 dpi stained for MYOD (red), Ki67 (green), and nuclei (blue). m Bar graphs representing MYOD+/Ki67+ and MYOD+/Ki67- myoblasts as percentage of total nuclei (left) and relative to each other (right) (n = 6 mice, 2 fields of view). Bars in c, e, g, i, k, m represent mean values and whiskers standard deviations. Statistical significance in c, e, g, I, k, m was calculated using a Student’s t-test. Scale bars in b, d, f, h, j, i = 50 μm. Graphs were generated using CorelDRAW and OriginPro.
Fig. 4
Fig. 4. Myoblast-derived ADAMTSL2 rescued delayed muscle regeneration after BaCl2 injury in CKO-Myf5 mice.
a Experimental design for wild type myoblast and FAP injection in CKO-Myf5 and CKO-Prx mice. b Representative images of freshly isolated primary myoblasts stained with for PAX7. c Quantification of PAX7 positive cells from b from n = 4 independent primary myoblast isolations. d Representative images of cross-sections of injured DMEM injected (Ctrl) or myoblast injected CKO-Myf5 TA muscles at 14 dpi. Sections were stained for eMyHC (red) and laminin (green). Nuclei were stained with DAPI (blue). e Quantification of myofiber CSA at 14 dpi (n = 4 mice, number of measured myofibers indicated). f Quantification of eMyHC mean fluorescence intensity at 7 dpi (n = 4 mice). g Representative images of cross-sections of injured DMEM injected or FAP-injected CKO-Myf5 TA muscles at 14 dpi. Sections were stained for eMyHC (red) and laminin (green). Nuclei were stained with DAPI (blue). h Quantification of myofiber CSA at 14 dpi (n = 4 mice, number of measured myofibers indicated above the violin plots). i Quantification of eMyHC mean fluorescence intensity at 14 dpi (n = 4 mice). j Representative images of cross-sections of injured DMEM injected (Ctrl) or myoblast injected CKO-Prx TA muscles at 14 dpi. Sections were stained for eMyHC (red) and laminin (green). Nuclei were stained with DAPI (blue). k Quantification of myofiber CSA at 14 dpi (n = 4 mice, number of measured myofibers indicated). l Quantification of eMyHC mean fluorescence intensity at 14 dpi (n = 4 mice). Horizontal lines in e, h, k represent the mean value and whiskers the standard deviation. Bars in c, f, i, l represent mean values and whiskers the standard deviation. Statistical significance in c, e, f, h, i, k, l was calculated using a Student’s t test. Scale bars in b = 50 μm, in d, g, j = 100 μm. Graphs were generated using CorelDRAW and OriginPro.
Fig. 5
Fig. 5. Recombinant ADAMTSL2 TSR2-7 protein promotes myoblast differentiation in vitro.
a Domain organization of full-length ADAMTSL2 and recombinant TSR2-7. The location of the pro-myogenic domains is indicated. b Coomassie-stained SDS-PAGE after separation of 5 μg purified TSR2-7 (predicted molecular weight: 50.2 kDa). c C2C12 myoblast differentiation in the presence of 100 μg recombinant ADAMTSL2 or TSR2-7 protein. Myotubes were stained for myosin heavy chain (MyHC, green). Nuclei were stained with DAPI (blue). d Quantification of the percentage of nuclei within multinucleated MyHC-positive myotubes (fusion index) in c (n = 4 independent experiments). e Differentiation of primary mouse myoblasts in the presence of 100 μg recombinant TSR2-7 protein. Myotubes were stained for MyHC (green). Nuclei were stained with DAPI (blue). f Quantification of the fusion index from e (n = 4 independent experiments, 2 fields-of-view). g Experimental design for TSR2-7 protein injection in wild type (WT) mice. h Representative images of TA cross-sections at 2 and 3 days after TSR2-7 injection. Sections were stained for the Myc-tag of TSR2-7 (red) and laminin (green). Nuclei were stained with DAPI (blue). Bars in d, f represent mean values and whiskers the standard deviation. Statistical significance in d, f was calculated using a Student’s t-test. Scale bars in c, e, h = 100 μm. Graphs were generated using CorelDRAW and OriginPro.
Fig. 6
Fig. 6. Recombinant ADAMTSL2 TSR2-7 promotes muscle regeneration.
a Experimental design for TSR2-7 injection in wild type and CKO-Myf5 mice after BaCl2 injury. b Representative images of cross-sections of PBS or TSR2-7 injected CKO-Myf5 TA muscles at 7 dpi. Sections were stained for eMyHC (red) and laminin (green). Nuclei were stained with DAPI (blue). c Quantification of myofiber CSA at 7 dpi (n = 4 mice, number of measured myofibers indicated). d Quantification of eMyHC mean fluorescence intensity at 7 dpi (n = 4 mice). e Representative images of cross-sections of PBS or TSR2-7 injected wild type TA muscles at 7 dpi. Sections were stained for eMyHC (red) and laminin (green). Nuclei were stained with DAPI (blue). f Quantification of myofiber CSA at 7 dpi (n = 5 mice, number of measured myofibers indicated). g Quantification of eMyHC mean fluorescence intensity at 7 dpi (n = 5). h Representative images of cross-sections of injured Ctrl or CKO-Myf5 TA muscles at 7 dpi. Sections were stained for PAX7 (red) and Ki67 (green). Nuclei were stained with DAPI (blue). i Bar graphs representing PAX7+/Ki67+ and PAX7+/Ki67- muscle stem cells as a percentage of total nuclei (left) and relative to each other (right) (n = 3-4 mice, 2 fields of view). j Representative images of cross-sections of injured Ctrl or CKO-Myf5 TA muscles at 7 dpi. Sections were stained for MYOD (red) and Ki67 (green). Nuclei were stained with DAPI (blue). k Bar graphs representing MYOD+/Ki67+ and MYOD+/Ki67- myoblasts as a percentage of total nuclei (left) and relative to each other (right) (n = 3-4 mice, 2 fields of view). Horizontal lines in c, f represent the mean value and whiskers the standard deviation. Bars in d, g, i, k represent mean values and whiskers the standard deviation. Statistical significance in d, g, i, k was calculated using a Student’s t-test. Scale bars in b, e, h, j = 50 μm. Graphs were generated using CorelDRAW and OriginPro.
Fig. 7
Fig. 7. ADAMTSL2-deficiency in myogenic progenitor cells attenuates muscle regeneration.
ADAMTSL2 regulates muscle regeneration by accelerating myoblast-to-myocyte differentiation, a critical step in the regeneration of contractile myofibers. Our data are consistent with delayed muscle regeneration of ADAMTSL2-deficient muscle compared the regeneration of wild type muscle (scenario I) or with a delayed and diminished regenerative response that still would result in complete muscle regeneration (scenario II). Scenario II is supported by our data since eMyHC staining continued to decline rapidly through 21 dpi in regenerating CKO-Myf5 TA muscles. In an alternative scenario, muscle regeneration would be delayed and does not fully resolve resulting in incomplete “chronic” muscle regeneration (scenario III). Graphics were generated using CorelDRAW and OriginPro.

References

    1. Collins, B. C. & Kardon, G. It takes all kinds: heterogeneity among satellite cells and fibro-adipogenic progenitors during skeletal muscle regeneration. Development148, 10.1242/dev.199861 (2021). - PMC - PubMed
    1. Corona, B. T., Wenke, J. C. & Ward, C. L. Pathophysiology of Volumetric Muscle Loss Injury. Cells Tissues Organs202, 180–188, (2016). - PubMed
    1. Corona, B. T., Rivera, J. C., Owens, J. G., Wenke, J. C. & Rathbone, C. R. Volumetric muscle loss leads to permanent disability following extremity trauma. J. Rehabil. Res. Dev.52, 785–792, (2015). - PubMed
    1. Mahdy, M. A. A. Skeletal muscle fibrosis: an overview. Cell Tissue Res.375, 575–588, (2019). - PubMed
    1. Mercuri, E., Bonnemann, C. G. & Muntoni, F. Muscular dystrophies. Lancet394, 2025–2038, (2019). - PubMed

LinkOut - more resources