. 2024 Dec 19;7(1):1679.
doi: 10.1038/s42003-024-07377-x.

Chemerin attenuates acute kidney injury by inhibiting ferroptosis via the AMPK/NRF2/SLC7A11 axis

Affiliations

Chemerin attenuates acute kidney injury by inhibiting ferroptosis via the AMPK/NRF2/SLC7A11 axis

Yidan Ma et al. Commun Biol. .

Abstract

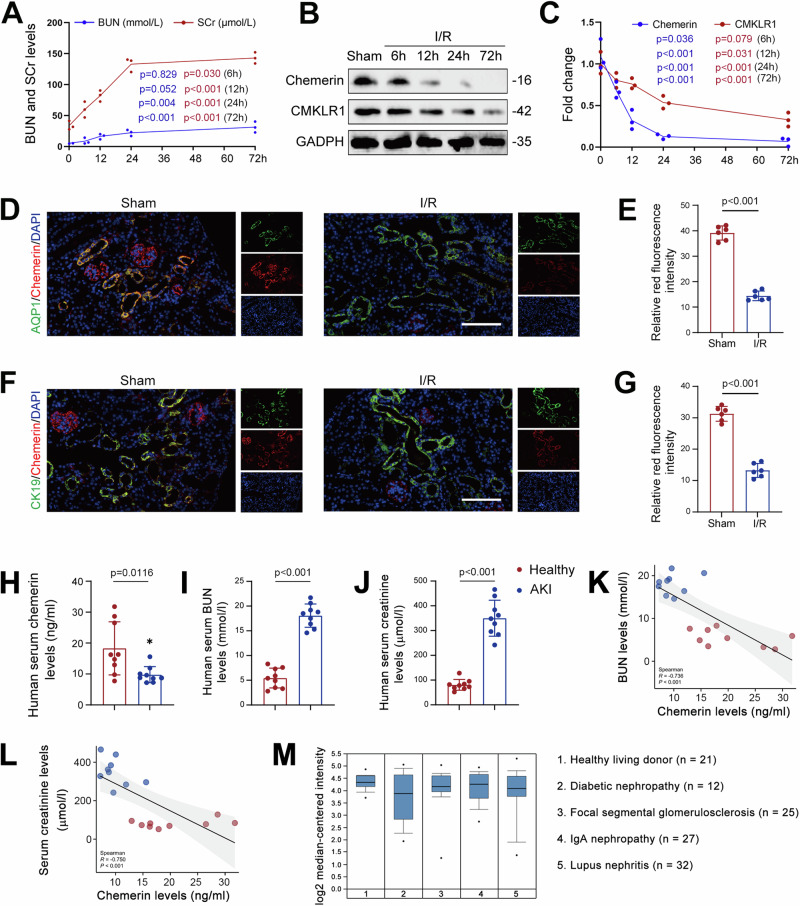
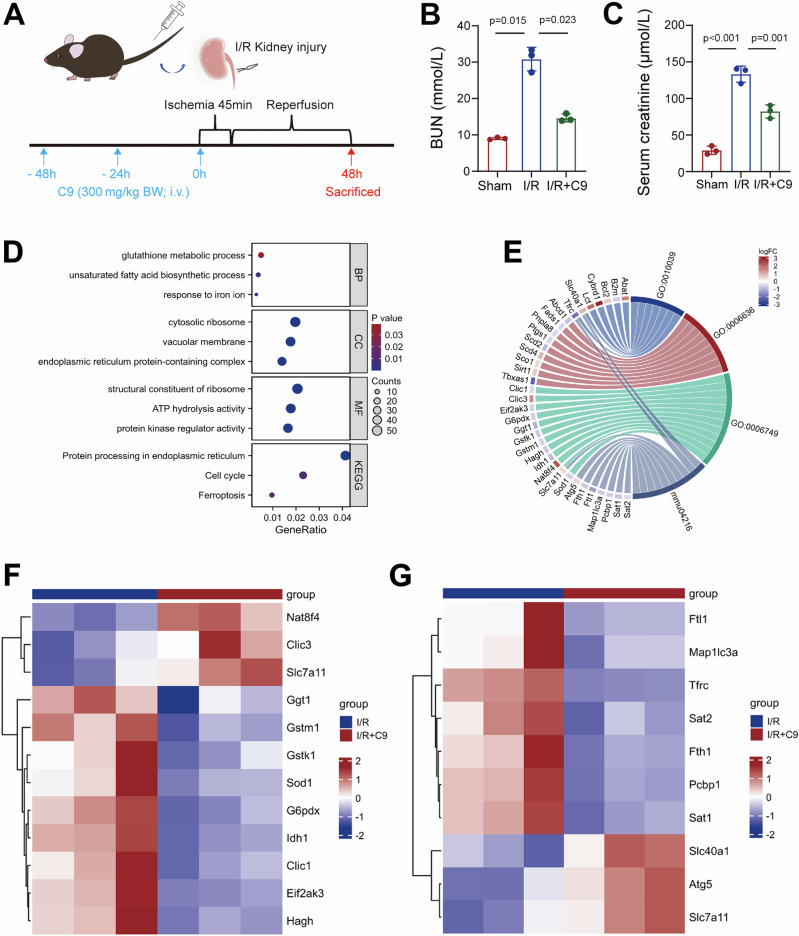
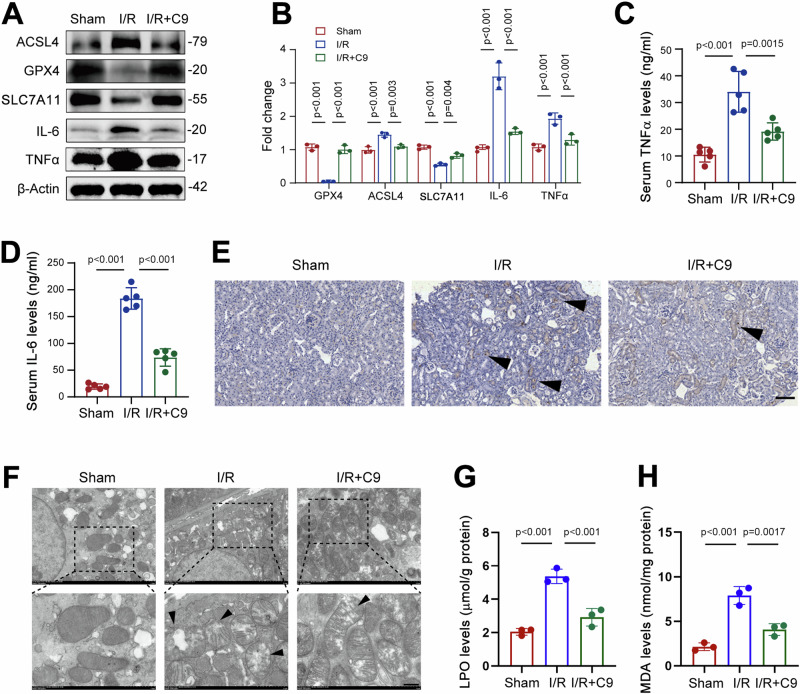
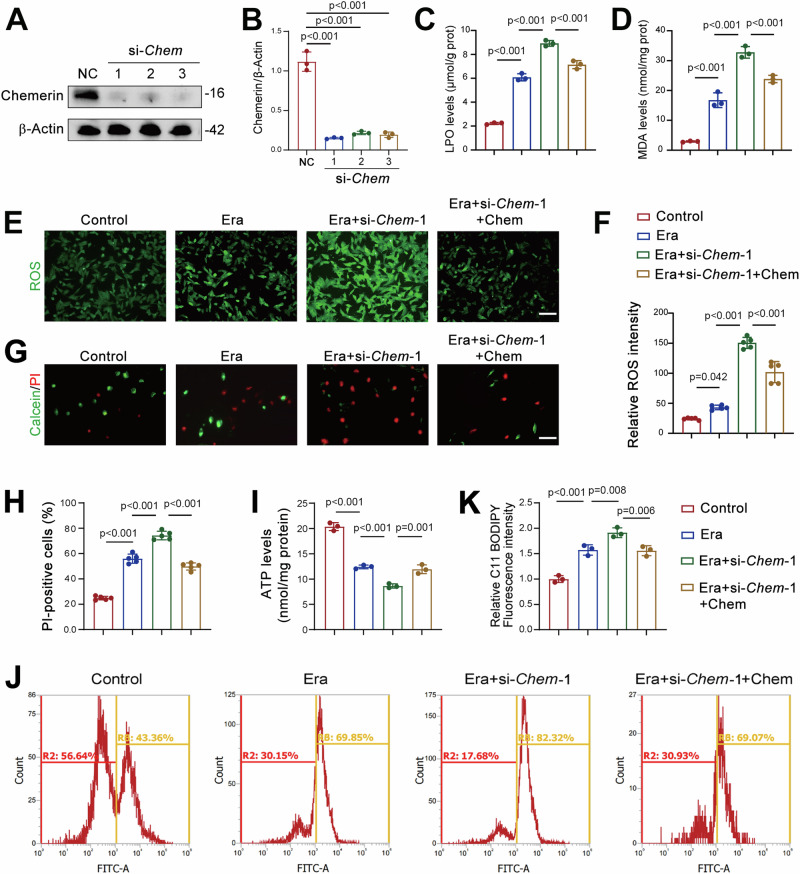
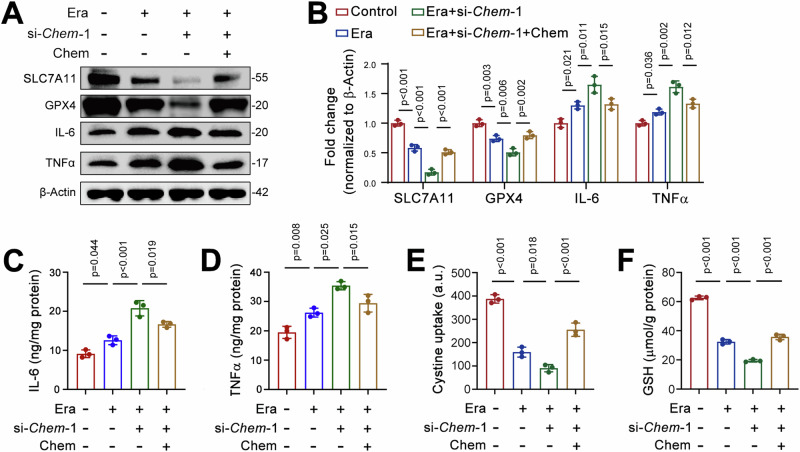
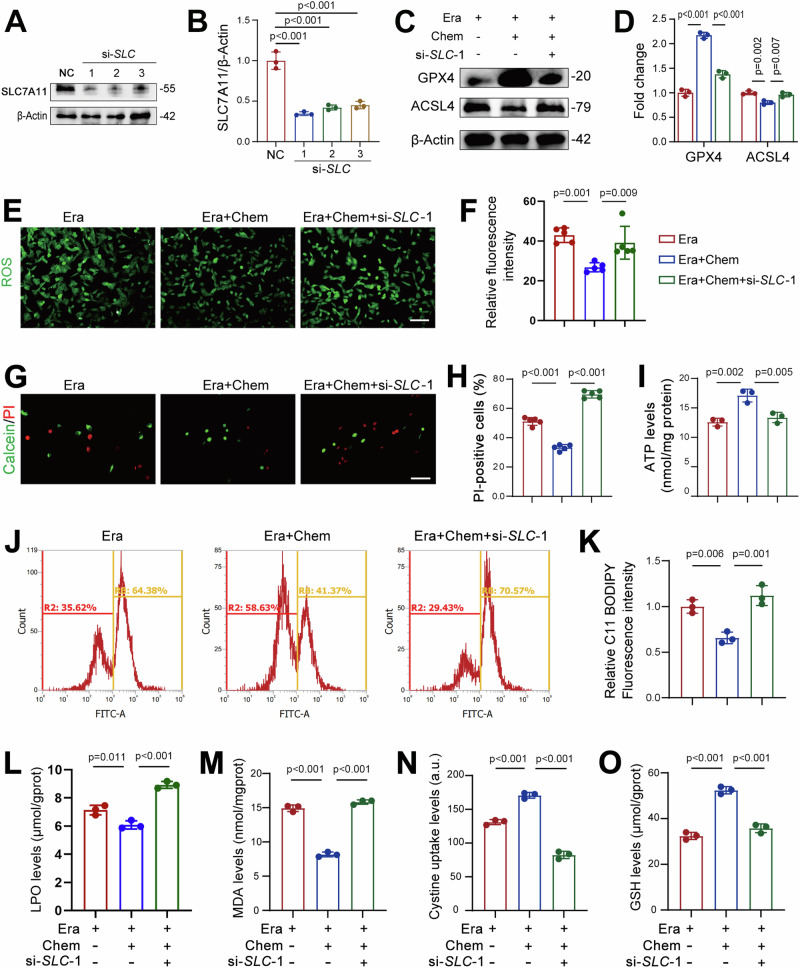
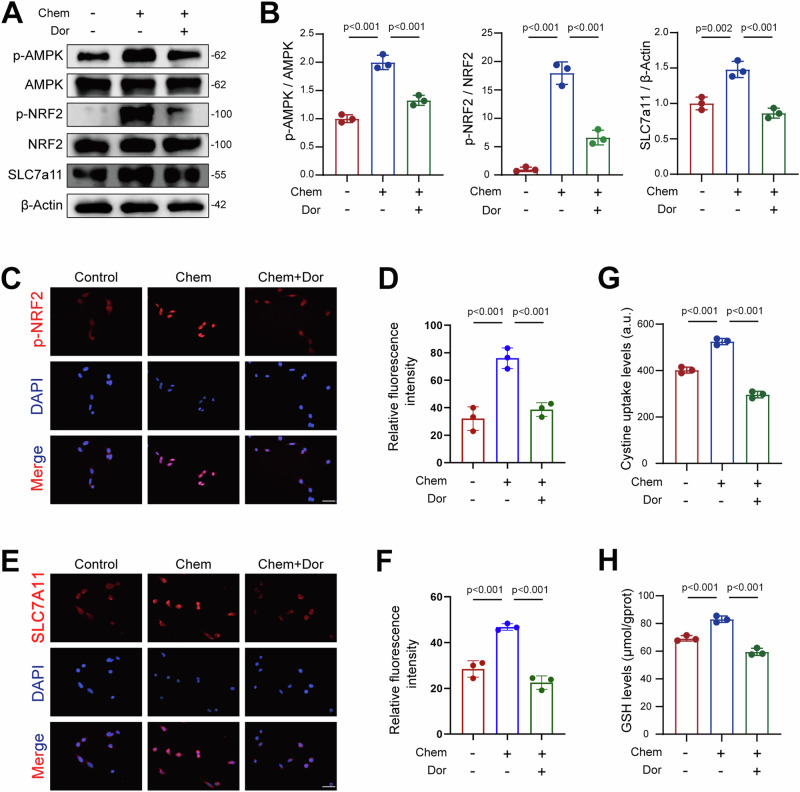
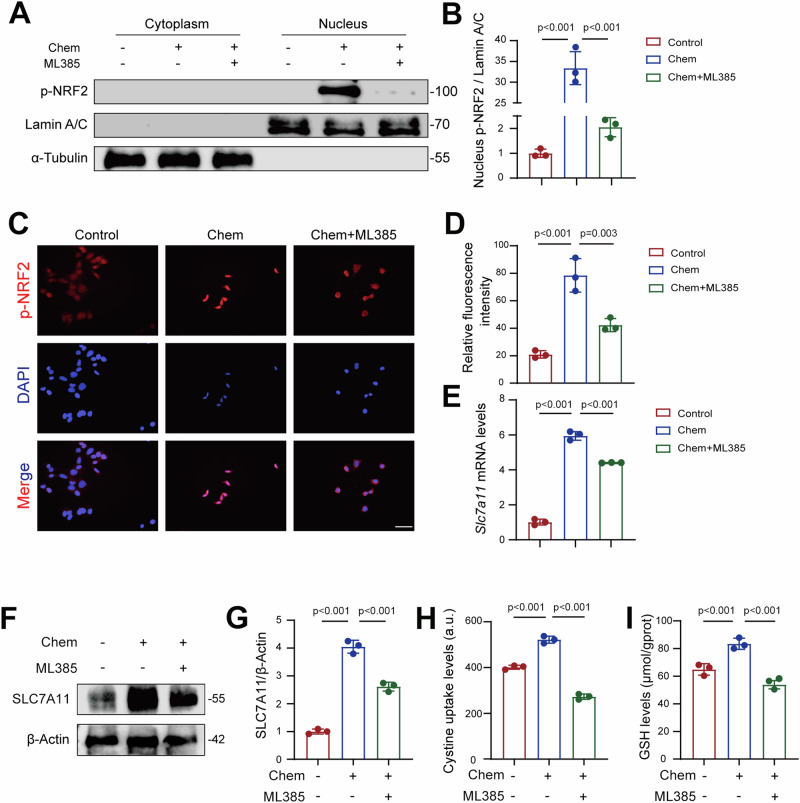
Acute kidney injury (AKI) is a common and life-threatening condition associated with cell death, where ferroptosis plays a critical role. Chemerin, primarily produced in white adipose tissue, has multiple biological functions in renal pathophysiology. However, to date, whether and how chemerin regulates the progression of AKI remain unclear. Here, we found that chemerin expression was reduced in both AKI model mice and cells. Similarly, serum chemerin levels were also decreased in AKI patients. The administration of recombinant chemerin improves renal function in ischemia-reperfusion (I/R) model mice. Chemerin significantly attenuates ferroptosis in kidneys. In TCMK-1 cells, chemerin knockdown further aggravates ferroptosis. Mechanistically, chemerin activates AMP-activated protein kinase (AMPK), which induces the phosphorylation of nuclear factor erythroid 2-related factor 2 (NRF2) in renal tubular cells. Subsequently, NRF2 translocates into the nucleus, where it stimulates the expression of cystine/glutamate antiporter solute carrier (SLC7A11). As a result, cystine uptake and glutathione (GSH) biosynthesis in renal tubular cells were increased, which confers cells with higher capacity against ferroptosis. Overall, our findings indicate that chemerin plays a protective role in AKI by repressing ferroptosis in renal tubular cells, which is likely due to the activation in the AMPK/NRF2/SLC7A11 axis.


Conflict of interest statement

Competing interests: The authors declare no competing interests.

Figures

Fig. 1
Fig. 1. Chemerin expression is reduced in AKI.
A Serum creatinine (SCr) and blood urea nitrogen (BUN) levels continuously increased in I/R model mice. n = 6 mice/group. B Temporal expression patterns of chemerin and CMKLR1 in the kidneys of I/R model mice. n = 3 (independent experiments). C Quantified data for chemerin and CMKLR1 from the western blots shown in (B). DG Immunofluorescence analysis of chemerin (red; D, F) expression in the renal cortices. Relative immunofluorescence intensities for chemerin are presented in (E) and (G), respectively. AQP1 (green; D) and CK19 (green; F) were used as markers for renal tubular epithelial cells, and DAPI (blue) was used to stain the nuclei. Scale bar = 100 μm. n = 6 mice/group. Serum chemerin (H), blood urea nitrogen (BUN; I), and creatinine (J) levels in healthy individuals and AKI patients. n = 9 humans/group. Spearman correlation analysis between serum chemerin and BUN (K) or creatinine (L). n = 9 humans/group. M Chemerin expression decreased in nephropathy patients. Data analysis from Nephroseq database (https://www.nephroseq.org). Data are presented as the mean ± SD, *p < 0.05, **p < 0.01, ***p < 0.001. One-way ANOVA with Tukey’s multiple comparison test was used for (A) and (C), Student’s t test was used for (E), (G)–(J).
Fig. 2
Fig. 2. Chemerin reduces renal injury in I/R model mice by affecting ferroptosis.
A Experimental scheme. Mice were intravenously (i.v.) injected with recombinant chemerin-9 (C9) at a dose of 300 mg/kg body weight (BW), administered 3 times as indicated. Simultaneously, the mice underwent I/R surgery. Forty-eight hours post-surgery, the mice were sacrificed for further analysis. C9 treatment reduces blood urea nitrogen (BUN; B) and serum creatinine (C) levels. n = 3 mice/group. D GO and KEGG analyses for differentially expressed genes. BP biological process, CC cellular component, MF molecular function, KEGG Kyoto encyclopedia of genes and genomes. E Chord diagram of differentially expressed genes. Kidney samples were subjected to RNA-Seq analysis. GO:0010039 represents the cluster of response to iron ion. GO:0006636 represents the cluster of unsaturated fatty acid biosynthetic process. GO:0006749 represents the cluster of glutathione metabolic process. mmu04216 represents the cluster of ferroptosis. Heatmap for differentially expressed genes involved in glutathione metabolic process (F) and ferroptosis (G). Data are presented as the mean ± SD, *p < 0.05, **p < 0.01, ***p < 0.001, by one-way ANOVA with Tukey’s multiple comparison test.
Fig. 3
Fig. 3. Chemerin-9 alleviates ferroptosis in the kidney to attenuate renal I/R injury.
A Western blot analysis of GPX4, ACSL4, SLC7A11, IL-6, and TNFα abundance in the kidneys. β-Actin was used as a loading control. n = 3 (independent experiments). B Quantified data from the western blots shown in (A). C, D Serum TNFα (C) and IL-6 (D) levels were reduced by C9 in I/R model mice. n = 5 mice/group. E Representative Prussian blue staining images showing iron deposition in the kidneys. Arrows indicate positive signals for iron staining. Scale bars = 100 μm. F Representative transmission electron microscopy (TEM) images showing mitochondrial structures in the kidneys. Arrows indicate damaged mitochondria. Scale bars = 5 μm. Lipid hydroperoxide (LPO; G) and malondialdehyde (MDA; H) levels were decreased by C9. n = 3 mice/group. Data are presented as the mean ± SD, *p < 0.05, **p < 0.01, ***p < 0.001, by one-way ANOVA with Tukey’s multiple comparison test.
Fig. 4
Fig. 4. Chemerin knockdown exacerbates ferroptosis in renal tubular cells.
A Western blot analysis showing the efficiency of chemerin knockdown. TCMK-1 cells were transfected with siRNA targets Chem (si-Chem). Seventy-two hours post-transfection, cells were harvested for western blot analysis. β-Actin was used as a loading control. n = 3 (independent experiments). B Quantified data from the western blots shown in (A). Recombinant chemerin counteracts the increases in lipid hydroperoxide (LPO; C) and malondialdehyde (MDA; D) levels induced by chemerin knockdown. TCMK-1 cells were transfected with si-Chem-1. Forty-eight hours post-transfection, cells were treated with recombinant chemerin (20 ng/ml) and erastin (Era, 5 μM) for additional 24 h. n = 3 (independent experiments). E Representative images showing reactive oxygen species (ROS). Cell treatments were described as in (C, D). n = 5 (independent experiments). Scale bar = 50 μm. F Quantified relative immunofluorescence intensity as shown in (E). G Calcein/PI staining showing live and dead cells. Cell treatments were described as in (C, D). n = 5 (independent experiments). Scale bar = 100 μm. H Quantified PI-positive cells from the calcein/PI staining in (G). I ATP levels. Cell treatments were described as in (C, D). n = 3 (independent experiments). J Lipid peroxidation. Oxidized lipids were captured by using C11 BODIPY and assayed by flow cytometry. Cell treatments were described as in (C, D). n = 3 (independent experiments). K Quantified lipid peroxidation from the flow cytometry in (J). Data are presented as the mean ± SD. **p < 0.01 and ***p < 0.001, by one-way ANOVA with Tukey’s multiple comparison test.
Fig. 5
Fig. 5. Chemerin knockdown aggravates ferroptosis in renal tubular epithelial cells.
A Recombinant chemerin reverses changes in SLC7A11, IL-6, and TNFα expression induced by chemerin knockdown. TCMK-1 cells were transfected with si-Chem-1. Forty-eight hours post-transfection, cells were treated with recombinant chemerin (20 ng/ml) and erastin (Era, 5 μM) for additional 24 h. Protein expression was analyzed by western blot, with β-Actin used as a loading control. n = 3 (independent experiments). B The quantified data for the western blots as shown in (A). IL-6 (C), TNFα (D), Cystine uptake (E), and GSH levels (F) levels in TCMK-1 cells treated with si-Chem-1 and recombinant chemerin. The treatment conditions were described in (A). n = 3 (independent experiments). Data are presented as the mean ± SD, *p < 0.05, **p < 0.01, and ***p < 0.001, by one-way ANOVA with Tukey’s multiple comparison test.
Fig. 6
Fig. 6. Chemerin mitigates ferroptosis by upregulating SLC7A11 expression in renal tubular epithelial cells.
A Knockdown of SLC7A11 by siRNA. TCMK-1 cells were transfected with siRNA targeting Slc7a11 (si-SLC). Seventy-two hours post-transfection, SLC7A11 expression was analyzed by western blot, with β-Actin used as a loading control. n = 3 (independent experiments). B Quantification of SLC7A11 expression from the western blots shown in (A). C SLC7A11 knockdown reverses the changes in GPX4 and ACSL4 induced by chemerin. TCMK-1 cells were transfected with si-SLC for 48 h, then treated with erastin (Era, 5 μM) and the recombinant chemerin (20 ng/ml) for an additional 24 h. Protein expression was analyzed by western blot, with β-Actin used as a loading control. n = 3 (independent experiments). D Quantification of GPX4 and SLC7A11 from the western blots shown in (C). E Reactive oxygen species (ROS) levels. Cell treatments were as described in (C). n = 5 (independent experiments). Scale bar = 50 μm. F Quantified ROS levels from the images shown in (E). G Calcein/PI staining. Cell treatments were as described in (C). n = 5 (independent experiments). Scale bar = 50 μm. H Quantified PI-positive cells from the images shown in (G). I ATP levels. Cell treatments were as described in (C). n = 3 (independent experiments). J Lipid peroxidation. Oxidized lipids were captured by using C11 BODIPY and assayed by flow cytometry. Cell treatments were as described in (C). n = 3 (independent experiments). K Quantified lipid peroxidation from the images shown in (J). Lipid hydroperoxide (LPO; L), malondialdehyde (MDA; M), cystine uptake (N), and GSH levels (O). Cell treatments were as described in (C). n = 3 (independent experiments). Data are presented as the mean ± SD. *p < 0.05, **p < 0.01, ***p < 0.001, by one-way ANOVA with Tukey’s multiple comparison test.
Fig. 7
Fig. 7. Chemerin alleviates ferroptosis through the AMPK/NRF2 pathway in renal tubular epithelial cells.
A Chemerin activates NRF2 and SLC7A11 in an AMPK-dependent manner. TCMK-1 cells were treated with the recombinant chemerin (20 ng/ml) and dorsomorphin (Dor, 5 μM) for 24 h. Protein levels were analyzed by western blot, with β-Actin used a loading control. n = 3 (independent experiments). B Quantified data from the western blots shown in (A). CF Representative immunofluorescence staining images for phosphorylated NRF2 (p-NRF2; C) and SLC7A11 (E). The corresponding relative immunofluorescence intensities are shown in (D) and (F), respectively. Cell treatments were as descried in (A). n = 3 (independent experiments). Scale bar = 50 μm. Cystine uptake (G) and GSH levels (H) in TCMK-1 cells treated with recombinant chemerin and Dor. Cell treatments were as described as in (A). n = 3 (independent experiments). Data are presented as the mean ± SD. **p < 0.01 and ***p < 0.001, by one-way ANOVA with Tukey’s multiple comparison test.
Fig. 8
Fig. 8. Chemerin promotes NRF2 nuclear translocation to induce SLC7A11 transcription in renal tubular epithelial cells.
A NRF2 inhibition prevents chemerin-induced nuclear translocation of NRF2. TCMK-1 cells were treated with recombinant chemerin (20 ng/ml) and NRF2 inhibitor ML385 (10 μM) for 24 h. Cytoplasmic and nuclear protein samples were prepared for western blot analysis. Lamin A/C was used as a loading control for nuclear proteins, and α-Tubulin was used as a loading control for cytoplasmic proteins. n = 3 (independent experiments). B Quantification of NRF2 levels from the western blots shown in (A). C Representative immunofluorescence staining images of phosphorylated NRF2 (p-NRF2). Cell treatments were as described in (A). n = 3 (independent experiments). Scale bar = 50 μm. D Relative fluorescence intensity of p-NRF2 as shown in (C). E mRNA levels of SLC7A11 in TCMK-1 cells treated with the recombinant chemerin and ML385. Cell treatments were as described in (A). n = 3 (independent experiments). F Western blot analysis of SLC7A11 in TCMK-1 cells treated with Chemerin and ML385. Cell treatments were as described in (A). β-Actin was used a loading control. n = 3 (independent experiments). G Quantification of SLC7A11 from the western blots shown in (F). Cystine uptake (H) and GSH levels (I). Cell treatments were as described in (A). n = 3 (independent experiments). Data are presented as the mean ± SD. **p < 0.01 and ***p < 0.001, by one-way ANOVA with Tukey’s multiple comparison test.

References

    1. See, E. J. et al. Long-term risk of adverse outcomes after acute kidney injury: a systematic review and meta-analysis of cohort studies using consensus definitions of exposure. Kidney Int.95, 160–172 (2019). - PubMed
    1. Poston, J. T. & Koyner, J. L. Sepsis associated acute kidney injury. BMJ364, k4891 (2019). - PMC - PubMed
    1. Bucaloiu, I. D. et al. Increased risk of death and de novo chronic kidney disease following reversible acute kidney injury. Kidney Int.81, 477–485 (2012). - PubMed
    1. Schetz, M., Gunst, J., De Vlieger, G. & Van den Berghe, G. Recovery from AKI in the critically ill: potential confounders in the evaluation. Intensive Care Med.41, 1648–1657 (2015). - PubMed
    1. Coca, S. G., Singanamala, S. & Parikh, C. R. Chronic kidney disease after acute kidney injury: a systematic review and meta-analysis. Kidney Int.81, 442–448 (2012). - PMC - PubMed

LinkOut - more resources