. 2024 Dec 19;7(1):1673.
doi: 10.1038/s42003-024-07364-2.

Thermoresponsive gel embedding extracellular vesicles from adipose stromal cells improves the healing of colonic anastomoses following irradiation in rats

Affiliations

Thermoresponsive gel embedding extracellular vesicles from adipose stromal cells improves the healing of colonic anastomoses following irradiation in rats

Hadrien Alric et al. Commun Biol. .

Abstract

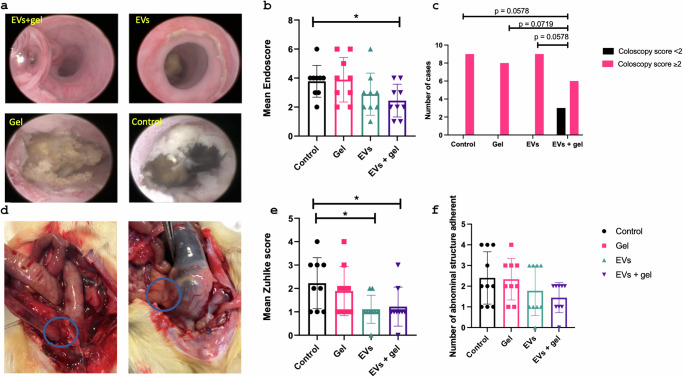
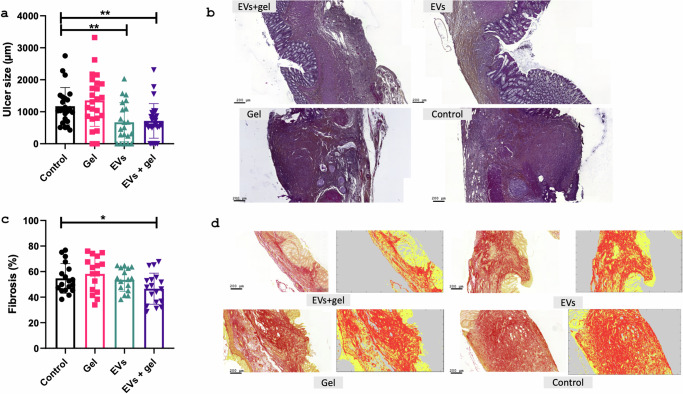
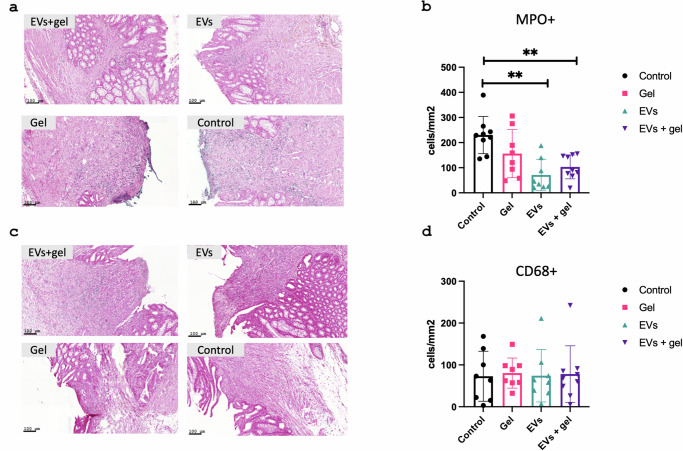
Anastomotic leak occurrence is a severe complication after colorectal surgery. Considering the difficulty of treating these leaks and their impact on patient care, there is a strong need for an efficient prevention strategy. We evaluated a combination of extracellular vesicles (EVs) from rat adipose-derived stromal cells with a thermoresponsive gel, Pluronic® F127 (PF-127) to prevent anastomotic leaks. The pro-regenerative and immunomodulatory potencies of EVs are assessed in vitro. In vivo efficacy are assessed in rat with a colonic anastomosis model after irradiation. Endoscopic, anatomical and histological data show a consistent effect of EVs + gel on the healing of colonic anastomosis. These results are illustrated by a smaller anastomotic ulcer size, less fibrosis and less inflammatory infiltrations in the EVs + gel group. This multi-modal investigation is the first to point-out the translational potential of EVs combined with PF-127 for the healing of high-risk colorectal anastomosis.


Conflict of interest statement

Competing interests: H.A., N.M., G.P., A.C.S., C.D., A.C., A.B., B.M., A.M., O.C., I.A.F. declare no competing interest. G.R. received personal fees from FUJIFILM, MEDTRONIC, and grants from NORGINE. F.G., A.S., C.W., and G.R. are co-founders of the spin-off Evora Biosciences. A.S. and C.W. are co-founders of the spin-off EverZom.

Figures

Fig. 1
Fig. 1. Characterization of ADSC and EVs.
The phenotype of amplified ADSC analyzed by flow cytometry before EVs production. Histograms representing the percentage of CD90, CD29, and CD73 mesenchymal markers, and CD34 and CD45 hematopoietic markers (a). After production, EVs concentration, mean, and mode were obtained by nanoparticle tracking analysis (b).
Fig. 2
Fig. 2. In vitro pro-angiogenic effect of EVs, assessed by scratch tests in HUVEC cells.
a Percentage of wound closure with increasing doses of EVs at 6 h, 12 h, and 18 h. Results are shown as the mean ± standard deviation with individual values (n = 12 biological replicates from 2 independent experiments). b Percentage of wound closure with increasing doses of gel-encapsulated EVs at 6 h, 12 h and 18 h. Results are shown as the mean ± standard deviation with individual values (n = 12 biological replicates from 2 independent experiments).
Fig. 3
Fig. 3. In vitro immunomodulatory potential of EVs, assessed by mixed lymphocyte reaction.
Lymphocytes from SD /CD and Wistar rat strains were mixed, stimulated for 48 h with PHA-M and ConA, then treated with rat ADSC EVs at a dose ranging from 0 (negative control) to 7.0.1010 particles per well. Lymphocyte proliferation rates were assessed at 24 h and normalized to the proliferation rate observed in the negative control group. Data are shown as the mean ± SD with individual values (6 biological replicates from 2 independent experiments per group).
Fig. 4
Fig. 4. Design of the in vivo experimental protocol.
A 12.5 Gy dose was delivered three times in 1 week through a 2 × 3 cm window centered on the colorectal region using a medical accelerator (a). Surgery was performed 3 weeks later with a low colo-colic anastomosis during which the treatment was applied: control (surgery procedure with administration of PBS), PF-127 alone, EVs alone, or PF-127 containing EVs (b). Eight weeks after the end of the irradiation, colo-colic anastomoses were evaluated by colonoscopy. Immediately after colonoscopy, the rats were sacrificed, and an autopsy was performed. The colonic anastomosis was then extracted for histological analysis (c).
Fig. 5
Fig. 5. Clinical evaluation at W8.
Representative colonoscopy pictures of the different group (a): the presence of anastomotic ulceration and its characterization was noted according to its severity (1: no ulcer, 2: superficial ulcer, 3: deep ulcer, 4: deep circumferential ulcer). Bleeding or stenosis of the anastomosis was also reported and combined in an ENDOSCORE (b and c). Pictures of colo-colic anastomosis during the autopsy (d). The blue circles highlight two entero-anastomotic fistulas. Graph representing the peritoneal adhesions by the Zuhlke score (e) and the number of structures adherent to the anastomosis (seminal vesicles, bladder, small bowel) (f).
Fig. 6
Fig. 6. Histological analysis of the anastomosis.
a graph representing the measurement of ulcer size at the anastomosis site (±SD). Two series of slides were analyzed in 8 rats of the control and gel groups. Nine rats of the EVs and EVs+gel groups were analyzed. b representative picture of HES slides at the colo-colic anastomosis level in the different groups (scale bar = 200μm). c graph representing the percentage (±SD) of fibrosis at the anastomosis level using the FIBER-ML program (scale bar = 200 μm). Two series of slides were analyzed in 8 rats of the control and gel groups. Nine rats of the EVs and EVs+gel groups were analyzed. d representative picture of RS slides and after the use of FIBER-ML program at the colo-colic anastomosis level (scale bar = 200 μm).
Fig. 7
Fig. 7. Immunohistochemical analysis of the anastomosis.
a representative picture of MPO immunostaining at the colo-colic anastomosis level in the different groups. Blue coloration corresponds to PMN cells and pink coloration corresponds to counter-colored tissue (scale bar = 100 μm). b graph representing the number of MPO positive cells per surface unit (±SD). c: representative of CD68 immunostaining at the colo-colic anastomosis level in the different groups. Blue coloration corresponds to macrophages and pink coloration corresponds to counter-colored tissue (scale bar = 100μm). d graph representing the number of CD68 positive cells per surface unit (±SD).

References

    1. Siegel, R. L., Miller, K. D. & Jemal, A. Cancer statistics, 2018: cancer statistics, 2018. CA Cancer J. Clin.68, 7–30 (2018). - PubMed
    1. Glynne-Jones, R., Wyrwicz, L. & Tiret, E. et al. Rectal cancer: ESMO Clinical Practice Guidelines for diagnosis, treatment and follow-up. Ann. Oncol.28, iv22–iv40 (2017). - PubMed
    1. Penna, M., Hompes, R. & Arnold, S. et al. Incidence and risk factors for anastomotic failure in 1594 patients treated by transanal total mesorectal excision: results from the international TaTME registry. Ann. Surg.269, 700–711 (2019). - PubMed
    1. Alves, A. Postoperative mortality and morbidity in French patients undergoing colorectal surgery: results of a prospective multicenter study. Arch. Surg.140, 278 (2005). - PubMed
    1. Krarup, P. M., Nordholm-Carstensen, A., Jorgensen, L. N. & Harling, H. Anastomotic leak increases distant recurrence and long-term mortality after curative resection for colonic cancer: a nationwide cohort study. Ann. Surg.259, 930–938 (2014). - PubMed

LinkOut - more resources