

The Role of Dynamic Contrast Enhanced Magnetic Resonance Imaging in Evaluating Prostate Adenocarcinoma: A Partially-Blinded Retrospective Study of a Prostatectomy Patient Cohort With Whole Gland Histopathology Correlation and Application of PI-RADS or TNM Staging
- PMID: 39702937
- PMCID: PMC11848987
- DOI: 10.1002/pros.24843
The Role of Dynamic Contrast Enhanced Magnetic Resonance Imaging in Evaluating Prostate Adenocarcinoma: A Partially-Blinded Retrospective Study of a Prostatectomy Patient Cohort With Whole Gland Histopathology Correlation and Application of PI-RADS or TNM Staging
Abstract
Background: Dynamic contrast-enhanced (DCE) magnetic resonance imaging (MRI) in the current Prostate Imaging-Reporting and Data System version 2.1 (PI-RADS v2.1) is considered optional, with primary scoring based on T2-weighted imaging (T2WI) and diffusion weighted imaging (DWI). Our study is designed to assess the relative contribution of DCE MRI in a patient-cohort with whole mount prostate histopathology and spatially-mapped prostate adenocarcinoma (PCa) for reference.
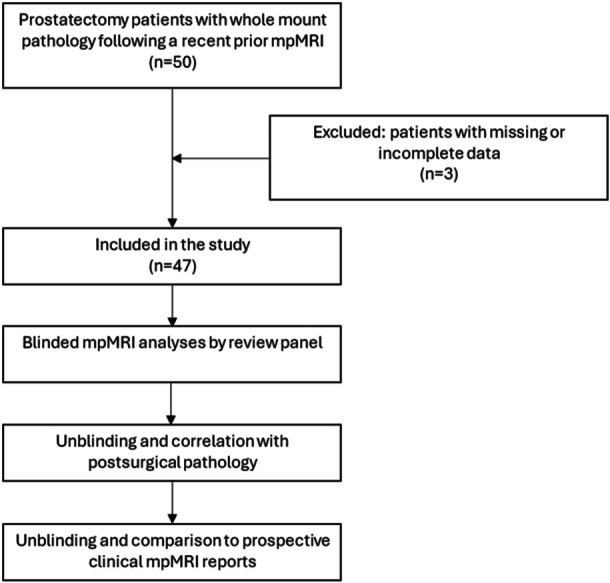
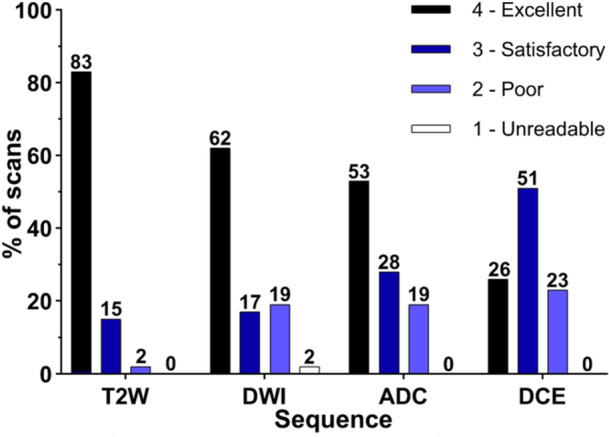
Methods: We performed a partially-blinded retrospective review of 47 prostatectomy patients with recent multi-parametric MRI (mpMRI). Scans included T2WI, DWI with apparent diffusion coefficient (ADC) mapping, and DCE imaging. Lesion conspicuity was scored on a 10-point scale with ≥ 6 considered "positive," and image quality was assessed on a 4-point scale for each sequence. The diagnostic contribution of DCE images was evaluated on a 4-point scale. The mpMRI studies were assigned PI-RADS scores and tumor, node, metastasis (TNM) T-stage with blinded comparison to spatially-mapped whole-mount pathology. Results were compared to the prospective clinical reports, which used standardized PI-RADS templates that emphasize T2WI, DWI and ADC.
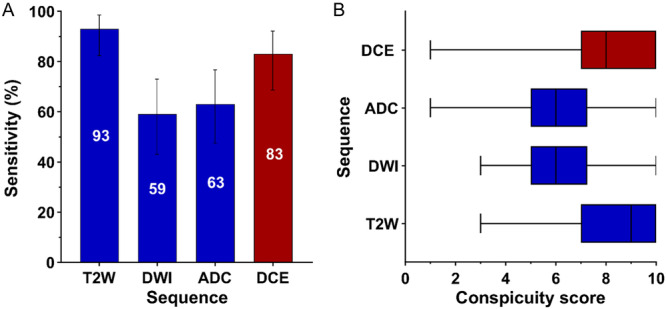
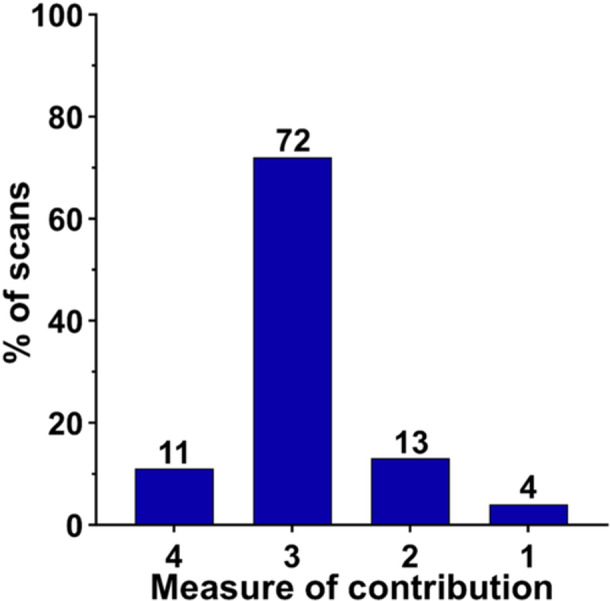
Results: Per lesion sensitivity for PCa was 93.5%, 82.6%, 63.0%, and 58.7% on T2WI, DCE, ADC and DWI, respectively. Mean lesion conspicuity was 8.5, 7.9, 6.2, and 6.1, on T2W, DCE, ADC and DWI, respectively. The higher values on T2WI and DCE imaging were not significantly different from each other but were both significantly different from DWI and ADC (p < 0.001). DCE scans were determined to have a marked diagnostic contribution in 83% of patients, with the most common diagnostic yield being detection of contralateral peripheral zone tumor or delineating presence/absence of extra-prostatic extension (EPE), contributing to more accurate PCa staging by PI-RADS or TNM, as compared to histopathology.
Conclusion: We demonstrate that DCE may contribute to lesion detection and local staging as compared to T2WI plus DWI-ADC alone and that lesion conspicuity using DCE is markedly improved as compared to DWI-ADC. These findings support modification of PI-RADS v2.1 to include use of DCE acquisitions and that a TNM staging is feasible on mpMRI as compared to surgical pathology.
Keywords: ADC; DCE; DWI; MRI; PI‐RADS; T2W; conspicuity; prostate cancer.
© 2024 The Author(s). The Prostate published by Wiley Periodicals LLC.
Conflict of interest statement
The authors declare no conflicts of interest.
Figures
Similar articles
-
Diagnostic impact of DWI absence on prostate lesion assessment using PI-RADS 2.1.Curr Probl Diagn Radiol. 2025 Sep-Oct;54(5):596-602. doi: 10.1067/j.cpradiol.2025.03.001. Epub 2025 Mar 8. Curr Probl Diagn Radiol. 2025. PMID: 40069017
-
Prospective evaluation of mpMRI-derived nomograms for detecting prostate cancer in PI-RADS v2.1 upgraded and non-upgraded lesions.Front Oncol. 2025 Jun 4;15:1510049. doi: 10.3389/fonc.2025.1510049. eCollection 2025. Front Oncol. 2025. PMID: 40535126 Free PMC article.
-
Predicting uninformative prostate magnetic resonance imaging sequences: a hypothesis-generating pilot study.Radiol Bras. 2025 Jul 17;58:e20250007. doi: 10.1590/0100-3984.2025.0007. eCollection 2025 Jan-Dec. Radiol Bras. 2025. PMID: 40688707 Free PMC article.
-
Magnetic resonance perfusion for differentiating low-grade from high-grade gliomas at first presentation.Cochrane Database Syst Rev. 2018 Jan 22;1(1):CD011551. doi: 10.1002/14651858.CD011551.pub2. Cochrane Database Syst Rev. 2018. PMID: 29357120 Free PMC article.
-
MRI software and cognitive fusion biopsies in people with suspected prostate cancer: a systematic review, network meta-analysis and cost-effectiveness analysis.Health Technol Assess. 2024 Oct;28(61):1-310. doi: 10.3310/PLFG4210. Health Technol Assess. 2024. PMID: 39367754 Free PMC article.
Cited by
-
An Innovative Approach with [68Ga]Ga-PSMA PET/CT: The Relationship Between PRIMARY Scores and Clinical and Histopathological Findings.Diagnostics (Basel). 2025 Jul 15;15(14):1779. doi: 10.3390/diagnostics15141779. Diagnostics (Basel). 2025. PMID: 40722528 Free PMC article.
References
-
- Bjurlin M. A., Carroll P. R., Eggener S., et al., “Update of the Standard Operating Procedure on the Use of Multiparametric Magnetic Resonance Imaging for the Diagnosis, Staging and Management of Prostate Cancer,” Journal of Urology 203, no. 4 (2020): 706–712, 10.1097/JU.0000000000000617. - DOI - PMC - PubMed
-
- American College of Radiology. PI‐RADS Version 2.1. Prostate Imaging‐Reporting and Data System. Published 2019, http://www.acr.org/~/media/ACR/Documents/PDF/QualitySafety/Resources/PIR....
-
- American Urological Association, Standard Operating Procedure for Multiparametric Magnetic Resonance Imaging in the Diagnosis, Staging and Management of Prostate Cancer, Standard Operating Procedure for Multiparametric Magnetic Resonance Imaging in the Diagnosis, Staging and Management of Prostate Cancer, https://www.auanet.org/guidelines-and-quality/guidelines/other-clinical-....
MeSH terms
Substances
Grants and funding
LinkOut - more resources
Full Text Sources
Medical
Research Materials
Miscellaneous
