. 2024 Dec;14(12):e70134.
doi: 10.1002/ctm2.70134.

LRH-1/NR5A2 targets mitochondrial dynamics to reprogram type 1 diabetes macrophages and dendritic cells into an immune tolerance phenotype

Affiliations

LRH-1/NR5A2 targets mitochondrial dynamics to reprogram type 1 diabetes macrophages and dendritic cells into an immune tolerance phenotype

Nadia Cobo-Vuilleumier et al. Clin Transl Med. 2024 Dec.

Abstract

Background: The complex aetiology of type 1 diabetes (T1D), characterised by a detrimental cross-talk between the immune system and insulin-producing beta cells, has hindered the development of effective disease-modifying therapies. The discovery that the pharmacological activation of LRH-1/NR5A2 can reverse hyperglycaemia in mouse models of T1D by attenuating the autoimmune attack coupled to beta cell survival/regeneration prompted us to investigate whether immune tolerisation could be translated to individuals with T1D by LRH-1/NR5A2 activation and improve islet survival.

Methods: Peripheral blood mononuclear cells (PBMCs) were isolated from individuals with and without T1D and derived into various immune cells, including macrophages and dendritic cells. Cell subpopulations were then treated or not with BL001, a pharmacological agonist of LRH-1/NR5A2, and processed for: (1) Cell surface marker profiling, (2) cytokine secretome profiling, (3) autologous T-cell proliferation, (4) RNAseq and (5) proteomic analysis. BL001-target gene expression levels were confirmed by quantitative PCR. Mitochondrial function was evaluated through the measurement of oxygen consumption rate using a Seahorse XF analyser. Co-cultures of PBMCs and iPSCs-derived islet organoids were performed to assess the impact of BL001 on beta cell viability.

Results: LRH-1/NR5A2 activation induced a genetic and immunometabolic reprogramming of T1D immune cells, marked by reduced pro-inflammatory markers and cytokine secretion, along with enhanced mitohormesis in pro-inflammatory M1 macrophages and mitochondrial turnover in mature dendritic cells. These changes induced a shift from a pro-inflammatory to an anti-inflammatory/tolerogenic state, resulting in the inhibition of CD4+ and CD8+ T-cell proliferation. BL001 treatment also increased CD4+/CD25+/FoxP3+ regulatory T-cells and Th2 cells within PBMCs while decreasing CD8+ T-cell proliferation. Additionally, BL001 alleviated PBMC-induced apoptosis and maintained insulin expression in human iPSC-derived islet organoids.

Conclusion: These findings demonstrate the potential of LRH-1/NR5A2 activation to modulate immune responses and support beta cell viability in T1D, suggesting a new therapeutic approach.

Key points: LRH-1/NR5A2 activation in inflammatory cells of individuals with type 1 diabetes (T1D) reduces pro-inflammatory cell surface markers and cytokine release. LRH-1/NR5A2 promotes a mitohormesis-induced immuno-resistant phenotype to pro-inflammatory macrophages. Mature dendritic cells acquire a tolerogenic phenotype via LRH-1/NR5A2-stimulated mitochondria turnover. LRH-1/NR5A2 agonistic activation expands a CD4+/CD25+/FoxP3+ T-cell subpopulation. Pharmacological activation of LRH-1/NR5A2 improves the survival iPSC-islets-like organoids co-cultured with PBMCs from individuals with T1D.

Keywords: autoimmune diseases; drug development; immune tolerance; pancreatic islets.


Conflict of interest statement

Two patents (WO 2011 144725 A2 and WO 2016 156531 A1) related to BL001 have been published of which B. R. G. and N. C. V. are inventors. M. V.‐P. holds a patent that relates to immunotherapy for T1D and is co‐founder and SEO of Ahead Therapeutics S.L., which aims at the clinical translation of immunotherapies for the treatment of autoimmune diseases. The other authors declare no competing interests related to the current study.

Figures

FIGURE 1
FIGURE 1
LRH‐1/NR5A2 activation reduces the pro‐inflammatory immune cell phenotype and cytokine secretion in T1D. Monocytes from healthy and T1D donors were differentiated into monocytes‐derived macrophages (MDM) of resting or pro‐inflammatory (M10 or M1) type and immature or mature dendritic cells (iDCs or mDCs). LRH1/NR5A1 activation was achieved by administering 10 µM BL001 every 24 h for 48 h, with a final dose 30 min before analysis. Macrophages cell surface markers (A) CD14, (B) CD80, (C) CD206 and DC cell surface markers, (D) CD54, (E) CXCR4, (F) CD25 and (G) CD36 were analysed by flow cytometry. Measurements were normalised to the mean fluorescence intensity (MFI) of M1 or mDC from controls. Data are presented as means ± SEM from n = 10 healthy and T1D individuals for MDM and DC markers. Male, black squares and female, black circles. Statistical analysis was performed as described in the materials and methods section: **p < 0.01 and ***p < 0.001. Flow cytometry histograms (untreated: orange and BL001 treated: blue) are shown only for the markers with statistically significant differences in T1D samples. Heatmaps depicting the average cytokine levels from individual donors for (H) MDM and (J) DCs. Bar graphs show relative changes in cytokine secretion for (I) MDM and (K) DCs, with treated values compared with their untreated counterpart. Only significantly altered cytokines are shown. Data are presented as percent changes compared with DMSO (non‐treated) for each cytokine. Unpaired Student t‐test *p < 0.05, **p < 0.01, ***p < 0.001, ****p < 0.001 compared with DMSO (non‐treated).
FIGURE 2
FIGURE 2
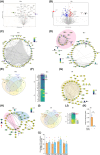
LRH‐1/NR5A2 agonism mitigates the pro‐inflammatory genetic program in T1D monocyte‐derived macrophages (MDM). Volcano plot of differentially expressed genes (DEGs; p value < 0.05) in BL001‐treated versus untreated (A) M10 (n = 6 independent donors) and (B) M1 (n = 6, independent donors). Dot plot of KEGG pathways enriched in BL001‐treated (C) M10 and (D) M1. Cnetplots of selected KEGG pathways of (E) M10 and (F) M1. Arrows highlight genes of interest which are described in the results.
FIGURE 3
FIGURE 3
Proteomic alterations induced by LRH‐1/NR5A2 activation in T1D monocyte‐derived macrophages. Volcano plot displaying the most significantly differentially expressed proteins (DEPs, p value < 0.05) in (A) BL001‐treated versus untreated M10, derived from n = 3 independent donors and (B) BL001‐treated versus untreated M1, from n = 3 independent donors. Arrows point to genes of interest which are described in the results section. Cytoscape circular layout of significantly (C) up‐regulated proteins and (D) down‐regulated proteins in BL001‐treated M10 compared with untreated controls. RNA‐associated proteins are highlighted within the grey‐shaded area while mitochondrial proteins are emphasised by the pink‐shaded area. (E) InteractiVenn diagram of differentially expressed transcripts/proteins that are significantly altered in either the RNAseq or proteomic analysis of BL001‐treated versus untreated M10. (F) Heatmap of differentially expressed transcripts/proteins common to both the RNAseq and proteomic analysis in BL001‐treated M10 versus untreated M10 marked by green circles in (E). Cytoscape circular layout of significantly (G) up‐regulated proteins and (H) down‐regulated proteins in BL001‐treated M1 as compared with untreated M1. Proteins involved in transcriptional/translational processes are within the French beige‐shaded area while mitochondrial proteins are highlighted in the pink shaded area and proteasome‐associated proteins are in the blue‐shaded area. (I) InteractiVenn diagram of differentially expressed transcripts/proteins that are significantly altered in either the RNAseq or proteomic analysis of BL001‐treated versus untreated M1. (J) Heatmap of differentially expressed transcripts/proteins common to both RNAseq and proteomic analysis of BL001‐treated M1 versus untreated M10 (red circles in I). Arrows point to genes of interest which are described in the results section. (K) Bar graph representing acetyl CoA levels in M1 treated or not with BL001 for n = 3 independent donors colour coded and each performed in triplicate. Data are presented as means ± SEM. Student t‐test *p < 0.05 as compared with untreated. (L) H3 acetylation levels in M1, treated or not with BL001, were assessed in five independent donors (colour coded). Data are presented as the mean ± SEM, expressed as a percentage relative to total H3 levels.
FIGURE 4
FIGURE 4
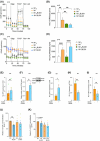
LRH‐1/NR5A2 activation stimulates mitohormesis to enforce LPS‐tolerance in T1D monocyte‐derived macrophages. A mitochondrial stress test was performed on T1D M10 and M1 (LPS/IFNg‐treated M10) treated with or without BL001. Oxygen consumption rate (OCR) (A) profiles and (B) calculated basal OCR. Extracellular acidification rate (ECAR) (C) profiles and (D) calculated basal ECAR. Oligo, oligomycin; FCCP, carbonyl cyanide‐p‐trifluoromethoxyphenylhydrazone; Rot, rotenone; Ant, antimycin A. Paired Student t‐test **p < 0.01 ****p < 0.0001. n = 4 independent donors. (E) Transcript levels of the mitohormesis‐associated gene ATF4, in BL001 treated or not M1 cells from T1D donors, normalised to the housekeeping gene CCNI (https://housekeeping.unicamp.br/). n = 5 independent colour‐coded donors. (F) Protein expression levels of ATF4 in BL001 treated or not M1 cells from T1D individuals and normalised to the housekeeping protein b‐actin. n = 3 independent colour‐coded donors. The figure includes a representative western blot image. Transcript levels of (G) GDF15, (H) IL‐1b and (I) NLRP3 in T1D M1 treated with or without BL001. Transcript levels were normalised to the housekeeping gene CCNI (https://housekeeping.unicamp.br/). n = 5 independent colour‐coded donors. Data are presented as means ± SEM. Paired Student t‐test *p < 0.05, **p < 0.01 as compared with untreated cells. Relative proliferation of autologous (J) CD4+ and (K) CD8+ T cells in response to co‐culture with T1D MDMs treated or not with 10 µM BL001. n = 10 independent colour‐coded donors. Paired Student t‐test ***p < 0.0001 as compared with untreated M1.
FIGURE 5
FIGURE 5
LRH‐1/NR5A2 promotes a tolerogenic phenotype to T1D mDC, suppressing autologous cytotoxic T‐cell proliferation. Volcano plot of DEGs in BL001‐treated versus untreated (A) iDCS (n = 5 independent donors) and (B) mDCs (n = 4 independent donors). (C) Dot plot of KEGG pathways enriched in BL001‐treated mDCs. Arrows point to pathways of interest which are described in the results section. (D) Cnetplots of selected KEGG pathways modulated by BL001 in mDCs. (E) Log2(FC) heatmap of common DEGs between mDC from T1D individuals after BL001 treatment (p value < 0.05) and in IL‐10‐induced TolDC versus mDC (GSE180761; padj < 0.05). (F and G) Oxygen consumption rate (OCR) profiles and calculated basal OCR as well as (H and I) extracellular acidification rate (ECAR) profiles and calculated basal ECAR of T1D iDC and mDC treated with or without BL001 and with palmitate. Oligo, oligomycin; FCCP, carbonyl cyanide‐p‐trifluoromethoxyphenylhydrazone; Rot, rotenone; Ant, antimycin A. n = 4 independent donors (colour matched). Paired Student t‐test *p < 0.05 and **p < 0.01 as compared with iDCs. (J) Representative confocal immunofluorescence images of cells labelled with MitoTracker green and MitoTracker red for mitochondria, with nuclei counterstained using DAPI. (K) Bar chart quantification for mitochondrial functionality, as determined by flow cytometry based on MitoTracker green and MitoTracker red. Representative flow cytometry plots are provided for illustration. n = 3 independent colour‐code donors. Paired Student t‐test *p < 0.05 as compared with untreated mDC. Bar plot ranking of the top ten GO biological process terms associated with (L) up‐regulated and (M) down‐regulated proteins in BL001‐treated mDCs (p value < 0.05) (N) Relative autologous proliferation of FoxP3+/CD4+ in the presence of T1D mDCs treated with or without 10 µM BL001. Paired Student t‐test **p < 0.01 as compared with untreated. Relative autologous proliferation of (O) CD4+ and (P) CD8+ T‐cells in the presence of T1D DCs treated with or without 10 µM BL001. Data are presented as means ± SEM. Paired Student t‐test *p < 0.05 as compared with untreated cells.
FIGURE 6
FIGURE 6
LRH‐1/NR5A2 agonism alters CD4+ and CD8+ T‐cell subpopulations in T1D individuals. PBMCs were purified from individuals with T1D and exposed to 10 µM BL001 every 24 h for a total duration of 48 h with a final dose given 30 min prior to analysis. Flow cytometry immunophenotyping of (A) CD4+CD25+ and (B) Tregs; CD4+CD25+FoxP3+ cell subpopulations. The initial gating defining the CD4 population was always set at 10 000 cells. n = 8 independent individuals with T1D. Relative transcript levels of (C) FoxP3, (D) CTLA4 and (E) GATA3. Data were normalised to the housekeeping gene RSP9. n = 5 T1D independent donors. Flow cytometry immunophenotyping of (F) Th1; CD4+CD196CD183+CD194 and (G) Th2; CD4+CD196CD183CD194+. The initial gating defining the CD4 population was always set at 10000 cells. n = 8 independent individuals with T1D. Relative (H) transcript and (I) secreted levels of IFNγ as well as of (J) IL‐4. Transcript levels of IFNγ were normalised to the housekeeping gene RSP9. n = 4–6 T1D independent donors. (K) Th17/22; CD4+CD196+CD183CD194+ immunophenotyping and (L) IL17 transcript levels normalised to the housekeeping gene RSP9. n = 6–8 T1D independent donors. (M) CD8+ immunophenotyping. n = 8 independent individuals with T1D. (O) CD4+ cells were isolated from PBMCs and treated with BL001 as described above. Cells were then analysed by flow cytometry for the cell surface markers CD25+FoxP3+. Relative (P) LRH‐1/NR5A2 and (Q) FoxP3 transcript levels in either siScrambled (siSc) or siNR5A2‐treated PBMCs. Data were normalised to the housekeeping gene RSP9. n = 3 T1D independent donors. CD14 PBMCs were labelled with CFSE and stimulated/expanded using antiCD3/CD28 before the addition of CD4+ T‐cells (at a 1:2 ratio, respectively, from the same donor). Proliferation of (R) CD4+/CFSE+ and (S) CD8+/CFSE+ subpopulations was assessed by flow cytometry 4 days post co‐culturing. n = 6 T1D independent donors. Each donor is colour coded. Data are presented as means ± SEM. Paired Student t‐test *p < 0.05 and **p < 0.01 as compared with untreated cells.
FIGURE 7
FIGURE 7
LRH1/NR5A2 activation modulates insulin production, apoptosis and immune response in human iPSCs‐derived islet‐like organoids co‐cultured with PBMCs from T1D individuals. Human IPSCs‐derived islet‐like organoids (hIPSC‐islet) were either cultured alone or co‐cultured with PBMCs from T1D donors, and treated or not with 10 µM BL001. (A) Transcript levels of insulin (INS) in hIPSC‐islets were measured and normalised to the housekeeping gene RPS9. (B) Quantification of TUNEL‐positive cells was determined by immunofluorescence to assess apoptosis in hIPSC‐islets. (C) Representative immunofluorescence images of (B) showing DAPI (blue) and TUNEL (yellow) staining in hIPSC‐islets alone (CNT) or with PBMCs, and treated with BL001 or not (CNT). (D) Stack bar with the quantification of INS (pink) and GCG (yellow) positive areas in hiPSC‐derived islets. Pink error bars refer to INS. (E) Representative immunofluorescence images showing insulin (INS; red), glucagon (GCG; green) and DAPI (blue) staining in hIPSC‐islets alone (CNT) or with PBMCs, and treated with BL001 or not (CNT). (F) IFNγ protein levels measured by BD™ Cytometric Bead Array (CBA) Human Th1/Th2 Cytokine Kit II in the media of PBMCs from T1D individuals co‐cultured with hiPSC islets, treated or not with 10 µM BL001. (G) Transcript levels of IFNγ in PBMCs from T1D individuals co‐cultured with hIPSC‐islets and treated or not with BL001, normalised to the housekeeping gene Cyclophilin. (H) Stack bar with the relative MFI values of CD4+ (green) and CD8+ (beige) from the PBMCs cultured with hIPSC‐derived islets. Beige error bars refer to CD8. The hIPSC‐derived islet‐like organoids were generated from separate differentiation experiments. Data are presented as means ± SEM from four independent experiments with four different T1D donors colour coded. Statistical significance was determined using a paired Student's t‐test, with *p < 0.05 and **p < 0.01 indicating significant differences compared with untreated cells.
FIGURE 8
FIGURE 8
Cellular and molecular mechanism of action mediated by the pharmacological effect of LRH‐1/NR5A2 in human cells. Proposed model of genetic and immune cell‐tailored reprogramming induced by LRH‐1/NR5A2 activation and its impact on T‐effector cell proliferation.

Similar articles

Cited by

References

    1. Ward ZJ, Yeh JM, Reddy CL, et al. Estimating the total incidence of type 1 diabetes in children and adolescents aged 0–19 years from 1990 to 2050: a global simulation‐based analysis. Lancet Diabetes Endocrinol. 2022;10(12):848‐858. - PubMed
    1. Herold KC, Delong T, Perdigoto AL, Biru N, Brusko TM, Walker LSK. The immunology of type 1 diabetes. Nat Rev Immunol. 2024;24(6):435‐451. - PMC - PubMed
    1. DiMeglio LA, Evans‐Molina C, Oram RA. Type 1 diabetes. Lancet. 2018;391(10138):2449‐2462. - PMC - PubMed
    1. Eizirik DL, Sammeth M, Bouckenooghe T, et al. The human pancreatic islet transcriptome: expression of candidate genes for type 1 diabetes and the impact of pro‐inflammatory cytokines. PLoS Genet. 2012;8(3):e1002552. - PMC - PubMed
    1. Szymczak F, Colli ML, Mamula MJ, Evans‐Molina C, Eizirik DL. Gene expression signatures of target tissues in type 1 diabetes, lupus erythematosus, multiple sclerosis, and rheumatoid arthritis. Sci Adv. 2021;7(2):eabd7600. - PMC - PubMed

Substances

LinkOut - more resources