. 2025 Mar 1;45(2):185-198.
doi: 10.3343/alm.2024.0178. Epub 2024 Dec 20.

CD69 Expression is Negatively Associated With T-Cell Immunity and Predicts Antiviral Therapy Response in Chronic Hepatitis B

Affiliations

CD69 Expression is Negatively Associated With T-Cell Immunity and Predicts Antiviral Therapy Response in Chronic Hepatitis B

Yurong Gu et al. Ann Lab Med. .

Abstract

Background: The function of CD69 expressed on T cells in chronic hepatitis B (CHB) remains unclear. We aimed to elucidate the roles of CD69 on T cells in the disease process and in antiviral therapy for CHB.

Methods: We enrolled 335 treatment-naive patients with CHB and 93 patients with CHB on antiviral therapy. CD69, antiviral cytokine production by T cells, T-helper (Th) cells, and inhibitory molecules of T cells were measured using flow cytometry, and clinical-virological characteristics were examined dynamically during antiviral therapy.

Results: CD69 expression on CD3+, CD4+, and CD8+ T cells was the lowest in the immune-active phase and was negatively correlated with liver transaminase activity, fibrosis features, inflammatory cytokine production by T cells, and Th-cell frequencies but positively with inhibitory molecules on T cells. CD69 expression on CD3+, CD4+, and CD8+ T cells decreased after 48 weeks of antiviral therapy, and patients with hepatitis B e antigen (HBeAg) seroconversion in week 48 showed lower CD69 expression on T cells at baseline and week 48. The area under the ROC curve of CD69 expression on T cells at baseline for predicting HBeAg seroconversion in week 48 was 0.870, the sensitivity was 0.909, and the specificity was 0.714 (P =0.002).

Conclusions: CD69 negatively regulates T-cell immunity during CHB, and its expression decreases with antiviral therapy. CD69 expression predicts HBeAg seroconversion in week 48. CD69 may play an important negative role in regulating T cells and affect the efficacy of antiviral therapy.

Keywords: Antiviral agents; CD69; Chronic hepatitis B; T cell; Therapy.


Conflict of interest statement

CONFLICTS OF INTEREST

None declared.

Figures

Fig. 1
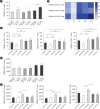
Fig. 1. CD69 expression on T cells and their subsets in treatment-naive patients with CHB and HCs. (A) CD69 levels on CD3+, CD4+ and CD8+ T cells in patients with CHB and HCs. (B–C) CD69 levels on T cells and the subset cells in patients with CHB in the IT, IA, IC, and GZ phases and HCs. (D) CD69 MFI of CD3+, CD4+ and CD8+ T cells in patients with CHB and HCs. (E) CD69 MFI of T cells and their subsets in patients with CHB in the IT, IA, IC and GZ phases and HCs. None of the continuous variables conformed to the normal distribution. P-values were calculated using the Mann–Whitney U test. *P<0.05, **P<0.01, ***P<0.001, ****P<0.0001.
Abbreviations: MFI, mean fluorescence intensity; CHB, chronic hepatitis B; HC, healthy control; IT, immune-tolerant; IA, immune-active; IC, inactive CHB; GZ, gray zone.
Fig. 2
Fig. 2. Correlation between CD69 and antiviral cytokine production by T cells. Levels of (A) IL-2, (B) IFN-γ, (C) TNF-α, (D) IL-6, and (E) granzyme B produced by CD3+, CD4+ and CD8+ T cells in the CD69high and CD69low groups, and correlations between these antiviral cytokines and CD69 levels on CD3+, CD4+ and CD8+ T cells. None of the continuous variables conformed to the normal distribution. Differences were analyzed using the Mann–Whitney U test. Spearman correlation was used for correlation analysis. *P<0.05, **P<0.01, ***P<0.001, ****P<0.0001.
Abbreviations: IL, interleukin; IFN-γ, interferon-gamma; ns, non-significant; TNF-α, tumor necrosis factor alpha.
Fig. 3
Fig. 3. Correlation between CD69 and Th-cell levels. Levels of (A) Th1, (B) Th2, (C) Th17, (D) Th22, and (E) Tfh cells in function of CD3+, CD4+, and CD8+ T cells in the CD69high and CD69low groups, and correlations between these Th cells and CD69 levels on CD3+, CD4+ and CD8+ T cells. None of the continuous variables conformed to the normal distribution. Differences were analyzed using the Mann–Whitney U test. Spearman correlation was used for correlation analysis. *P<0.05, **P<0.01, ***P<0.001, ****P<0.0001.
Abbreviations: Th, T-helper; Tfh, T follicular helper.
Fig. 4
Fig. 4. Correlation between CD69 and inhibitory molecule production by T cells. Levels of (A) PD-1, (B) CTLA-4, (C) LAIR-1, and (D) LAG-3 on CD3+, CD4+ and CD8+ T cells in the CD69high and CD69low groups, and correlations between these inhibitory molecules and CD69 levels on CD3+, CD4+, and CD8+ T cells. None of the continuous variables conformed to the normal distribution. Differences were analyzed using the Mann–Whitney U test. Spearman correlation was used for correlation analysis. *P<0.05, **P<0.01, ***P<0.001, ****P<0.0001.
Abbreviations: PD-1, programmed death receptor 1; CTLA-4, cytotoxic T lymphocyte-associated antigen-4; ns, non-significant; LAIR-1, leukocyte-associated Ig-like receptor-1; LAG-3, lymphocyte activation gene-3.
Fig. 5
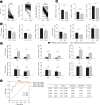
Fig. 5. CD69 levels on T cells decrease after 48 weeks of antiviral therapy and predict HBeAg seroconversion. (A) Changes in ALT, HBsAg, and HBV DNA levels after antiviral therapy for 48 weeks. (B, C) Changes in CD69 levels on CD3+, CD4+, and CD8+ T cells after 48 weeks of antiviral therapy based on ETV and Peg-IFN treatment, respectively. (D) Differences in CD69 expression on T cells at baseline and in week 48 between patients who achieved HBeAg seroconversion and those who did not for ETV and Peg-IFN treatment, respectively. (E) ROC analysis of the combined (ROC1) or solo expression of CD69 on CD3+ (ROC2), CD4+ (ROC3) and CD8+ (ROC4) T cells at baseline for predicting HBeAg seroconversion in week 48 in ETV-treated patients. None of the continuous variables conformed to the normal distribution Differences were analyzed using Wilcoxon matched-pairs rank test. *P<0.05, **P<0.01, ***P<0.001, ****P<0.0001.
Abbreviations: ALT, alanine transaminase; HBsAg, hepatitis B surface antigen; HBV, hepatitis B virus; ETV, entecavir; PEG: Peg-interferon; HBeAg, hepatitis B e antigen; ns, non-significant; AUC: area under the ROC curve; w, weeks.

Similar articles

Cited by

References

    1. Revill PA, Chisari FV, Block JM, Dandri M, Gehring AJ, Guo H, et al. A global scientific strategy to cure hepatitis B. Lancet Gastroenterol Hepatol. 2019;4:545–58. doi: 10.1016/S2468-1253(19)30119-0. - DOI - PMC - PubMed
    1. Bertoletti A, Wang FS. Overview of the special issue on HBV immunity. Cell Mol Immunol. 2015;12:253–4. doi: 10.1038/cmi.2015.24. - DOI - PMC - PubMed
    1. Bertoletti A, Ferrari C. Adaptive immunity in HBV infection. J Hepatol. 2016;64(S):S71–83. doi: 10.1016/j.jhep.2016.01.026. - DOI - PubMed
    1. Sancho D, Gómez M, Sánchez-Madrid F. CD69 is an immunoregulatory molecule induced following activation. Trends Immunol. 2005;26:136–40. doi: 10.1016/j.it.2004.12.006. - DOI - PubMed
    1. Hamann J, Fiebig H, Strauss M. Expression cloning of the early activation antigen CD69, a type II integral membrane protein with a C-type lectin domain. J Immunol. 1993;150:4920–7. doi: 10.4049/jimmunol.150.11.4920. - DOI - PubMed

MeSH terms

LinkOut - more resources