. 2025 Feb;265(2):226-243.
doi: 10.1002/path.6381. Epub 2024 Dec 20.

Characterisation of GPR17-expressing oligodendrocyte precursors in human ischaemic lesions and correlation with reactive glial responses

Affiliations

Characterisation of GPR17-expressing oligodendrocyte precursors in human ischaemic lesions and correlation with reactive glial responses

Stefano Raffaele et al. J Pathol. 2025 Feb.

Abstract

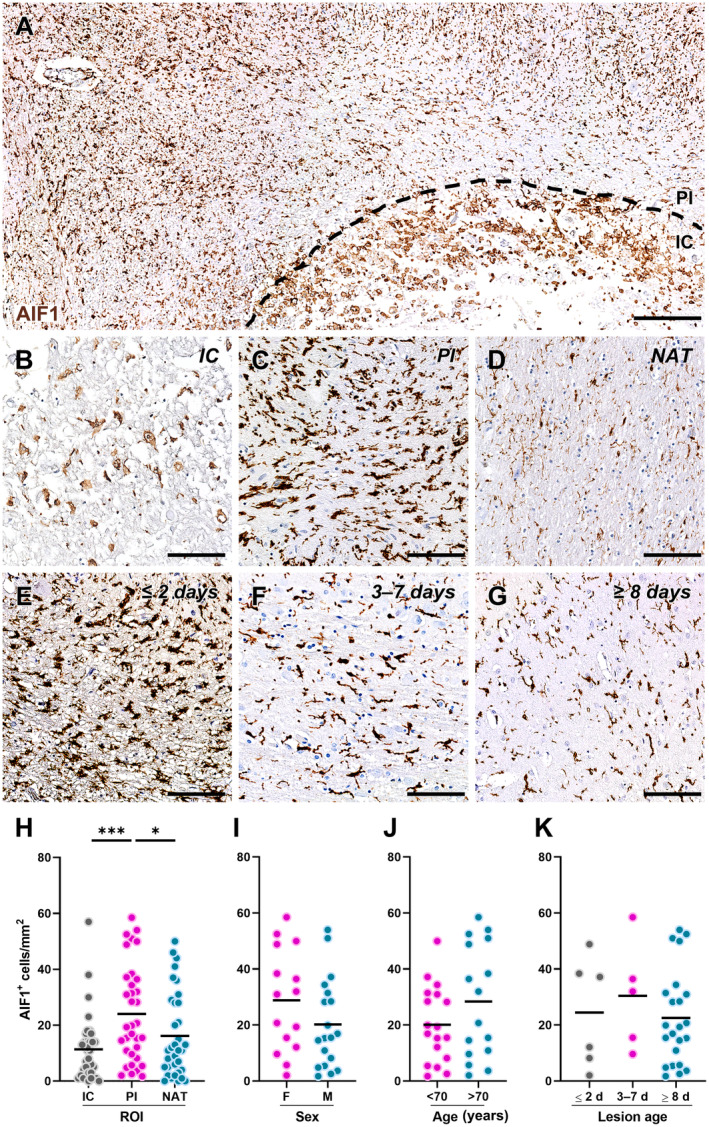
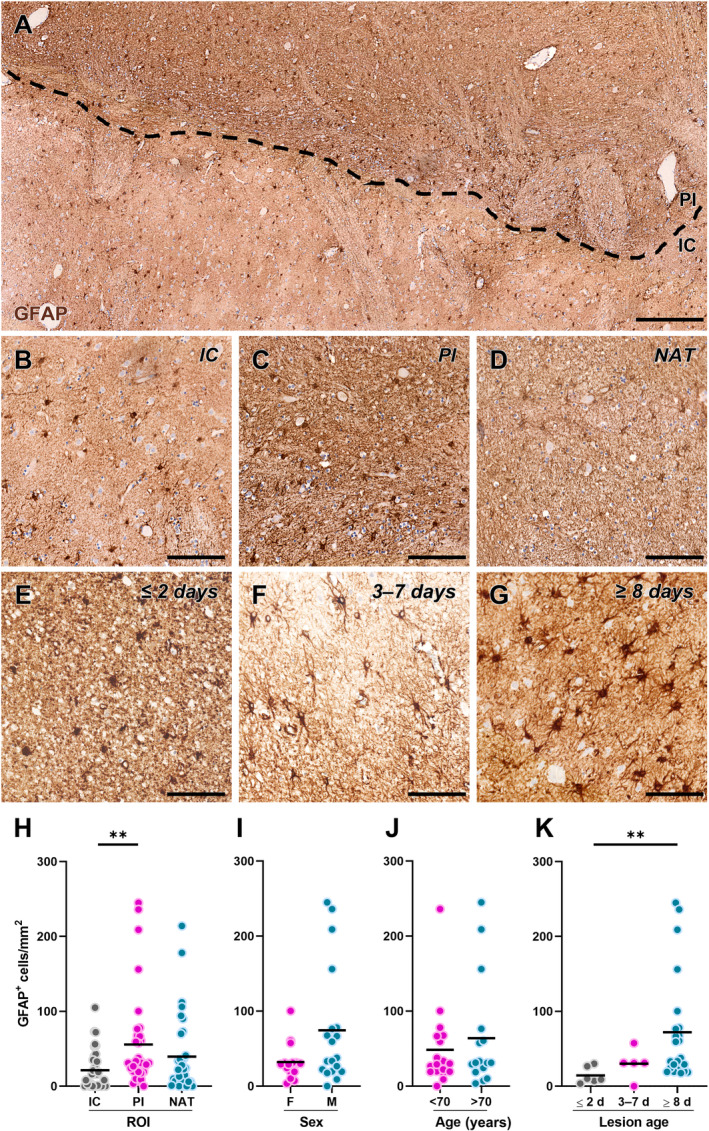
White matter damage and subsequent demyelination significantly contribute to long-term functional impairment after ischaemic stroke. Identifying novel pharmacological targets to restore myelin integrity by promoting the maturation of oligodendrocyte precursor cells (OPCs) into new myelinating oligodendrocytes may open new perspectives for ischaemic stroke treatment. In this respect, previous studies highlighted the role of the G protein-coupled membrane receptor 17 (GPR17) as a key regulator of OPC differentiation in experimental models of brain injury, including ischaemic stroke. To determine the translational value of GPR17 as a possible target in the context of human disease, we exploited immunohistochemistry to characterise the distribution of GPR17-expressing cells in brain tissue samples from ischaemic stroke cases and correlated it with the reactive state of neighbouring glial cells. The results showed that GPR17 specifically decorates a subpopulation of differentiation-committed OPCs, labelled by the peculiar marker breast carcinoma-amplified sequence 1 (BCAS1), that accumulates in the peri-infarct region in the later stages after the ischaemic event. Interestingly, the response of GPR17-expressing cells appears to be paralleled by the switch of reactive microglia/macrophages from a phagocytic to a dystrophic phenotype and by astrocytic scar formation. A negative correlation was found between GPR17-expressing OPCs and reactive microglia/macrophages and astrocytes surrounding chronic ischaemic lesions in female subjects, while the same relationship was less pronounced in males. These results were reinforced by bioinformatic analysis of a publicly available transcriptomic dataset, which implicated a possible role of inflammation and defective neuron-to-OPC communication in remyelination failure after ischaemic damage. Hence, these data strengthen the relevance of GPR17-based remyelinating therapies for the treatment of ischaemic stroke. © 2024 The Author(s). The Journal of Pathology published by John Wiley & Sons Ltd on behalf of The Pathological Society of Great Britain and Ireland.

Keywords: GPR17 receptor; astrocytes; glial cell interactions; ischaemic stroke; microglia; neuroinflammation; oligodendrocyte precursor cells; oligodendrocytes; post‐mortem brain tissue; remyelination.


Figures

Figure 1
Figure 1
Characterisation of GPR17‐expressing cell identity in human ischaemic lesions. (A) Representative images of cells co‐expressing G protein‐coupled membrane receptor 17 (GPR17) (magenta) and the immature oligodendrocyte (OL) marker breast carcinoma amplified sequence 1 (BCAS1) (cyan), indicated by arrowheads, in post‐mortem human brain tissues from subjects affected by ischaemic stroke. The cell enclosed in the dashed white square is magnified in B. (B–D) Representative images of cells labelled for GPR17 (magenta) and the immature OL marker BCAS1 (B), the early OPC marker A2B5 (C), or the myelinating OL marker CNPase (D) in post‐mortem human brain tissues from subjects affected by ischaemic stroke (cyan). Scale bar: 50 μm. (E–G) Representative images of cells labelled for GPR17 (magenta) and the astrocyte marker GFAP (E), the microglia/macrophage marker AIF1 (also known as ionised calcium‐binding adapter molecule 1, IBA1) (F), or the neuronal marker NeuN (G) in post‐mortem human brain tissues from subjects affected by ischaemic stroke (cyan). Scale bar: 50 μm. (H) Representative images of cells labelled for GPR17 (magenta) and CNPase (cyan), showing accumulation of GPR17‐expressing cells (indicated by arrowheads) in the peri‐infarct (PI) area, while they are absent in the demyelinated ischaemic core (IC). PI area and IC are separated by the white dashed line. Scale bar: 200 μm.
Figure 2
Figure 2
Distribution of GPR17‐expressing oligodendrocyte precursor cells (OPCs) in human ischaemic lesions. (A) Representative image of cells labelled for G protein‐coupled membrane receptor 17 (GPR17) in post‐mortem human brain tissue from a subject affected by ischaemic stroke. The black dashed line separates the infarct core (IC) and the peri‐infarct (PI) area. Scale bar: 250 μm. (B–D) Representative images of cells labelled for GPR17 in the IC (B), PI area (C), and normal‐appearing tissue (NAT) (D). Scale bar: 100 μm. (E–G) Representative images of cells labelled for GPR17 in the PI area of acute lesions (≤2 days; E), subacute lesions (3–7 days; F), and chronic lesions (≥8 days; G). Scale bar: 100 μm. (H) Quantification of GPR17‐expressing cell density in each region of interest (ROI), namely IC, PI area, and NAT, in post‐mortem human brain tissues from subjects affected by ischaemic stroke (n = 34). ****p < 0.0001, Kruskal–Wallis test followed by Dunn's post hoc analysis. (I and J) Quantification of GPR17‐expressing cell density in the PI region stratified by sex (I; females: n = 15; males: n = 19) and age (J; <70 years old: n = 18; >70 years old: n = 16) of the subjects. (K) Quantification of GPR17‐expressing cell density in the PI region stratified by the time elapsed since the ischaemic event (lesion age: ≤2 days, n = 6; 3–7 days, n = 5; ≥8 days, n = 23). *p < 0.05, Kruskal–Wallis test followed by Dunn's post hoc analysis.
Figure 3
Figure 3
Distribution of allograft inflammatory factor 1 (AIF1)‐expressing microglia/macrophages in human ischaemic lesions. (A) Representative image of cells labelled for AIF1 in post‐mortem human brain tissue from a subject affected by ischaemic stroke. The black dashed line separates the infarct core (IC) and the peri‐infarct (PI) area. Scale bar: 250 μm. (B–D) Representative images of cells labelled for AIF1 in the IC (B), PI area (C), and normal‐appearing tissue (NAT) (D). Scale bar: 100 μm. (E–G) Representative images of cells labelled for AIF1 in the PI area of acute lesions (≤2 days; E), subacute lesions (3–7 days; F), and chronic lesions (≥8 days; G). Scale bar: 100 μm. (H) Quantification of AIF1‐expressing cell density in each region of interest (ROI), namely IC, PI area, and NAT, in post‐mortem human brain tissues from subjects affected by ischaemic stroke (n = 34). *p < 0.05, ***p < 0.001, Kruskal–Wallis test followed by Dunn's post hoc analysis. (I and J) Quantification of AIF1‐expressing cell density in the PI region stratified by sex (I; females: n = 15; males: n = 19) and age (J; <70 years old: n = 18; >70 years old: n = 16) of the subjects. (K) Quantification of AIF1‐expressing cell density in the PI region stratified by the time elapsed since the ischaemic event (lesion age: ≤2 days, n = 6; 3–7 days, n = 5; ≥8 days, n = 23).
Figure 4
Figure 4
Morphological traits of allograft inflammatory factor 1 (AIF1)‐expressing microglia/macrophages in human ischaemic lesions. (A–C) Binary mask of cells labelled for AIF1 in the peri‐infarct (PI) area of post‐mortem human brain tissue collected ≤2 days (A), 3–7 days (B), and ≥8 days (C) after ischaemic stroke, used for morphological analysis. (D–F) Quantification of AIF1‐expressing cell size (D), circularity (E), and elongation index (F) in the PI region stratified by the time elapsed since the ischaemic event (lesion age: ≤2 days, n = 433; 3–7 days, n = 658; ≥8 days, n = 776). *p < 0.05, **p < 0.01, ***p < 0.001, ****p < 0.0001, KruskalWallis test followed by Dunn's post hoc analysis. Dashed lines indicate median and quartiles. (G–I) Representative images of cells labelled for CD68 in the PI area of acute lesions (≤2 days; G), subacute lesions (3–7 days; H), and chronic lesions (≥8 days; I). Scale bar: 100 μm.
Figure 5
Figure 5
Distribution of glial fibrillary acidic protein (GFAP)‐expressing astrocytes in human ischaemic lesions. (A) Representative image of cells labelled for GFAP in post‐mortem human brain tissue from a subject affected by ischaemic stroke. The black dashed line separates the infarct core (IC) and the peri‐infarct (PI) area. Scale bar: 250 μm. (B–D) Representative images of cells labelled for GFAP in the IC (B), PI area (C), and normal‐appearing tissue (NAT; D). Scale bar: 100 μm. (E–G) Representative images of cells labelled for GFAP in the PI area of acute lesions (≤2 days; E), subacute lesions (3–7 days; F), and chronic lesions (≥8 days; G). Scale bar: 100 μm. (H) Quantification of GFAP‐expressing cell density in each region of interest (ROI), namely IC, PI area, and NAT, in post‐mortem human brain tissues from subjects affected by ischaemic stroke (n = 34). **p < 0.01, Kruskal–Wallis test followed by Dunn's post hoc analysis. (I and J) Quantification of GFAP‐expressing cell density in the PI region stratified by sex (I; females: n = 15; males: n = 19) and age (J; <70 years old: n = 18; >70 years old: n = 16) of the subjects. (K) Quantification of GFAP‐expressing cell density in the PI region stratified by the time elapsed since the ischaemic event (lesion age: ≤2 days, n = 6; 3–7 days, n = 5, ≥8 days, n = 23). **p < 0.01, Kruskal–Wallis test followed by Dunn's post hoc analysis.
Figure 6
Figure 6
Enrichment and network analysis of differentially expressed genes between human ischaemic lesions and normal‐appearing tissues (NAT). (A–D) Cell types (A), subcellular structures (B), biological processes (C), and molecular pathways (D) significantly enriched in the dataset of differentially expressed genes (DEGs) between human ischaemic lesions and normal‐appearing tissue, emerging from the functional enrichment analysis. The over‐representation of each term in the DEG dataset is expressed as odds ratio. (E and F) Table showing the top hub genes of the network with their degree and betweenness centrality and log2 FC (E), and the zero‐order network (F) generated by means of the NetworkAnalyst software using DEGs with log2 FC > |0.6|. Protein–protein interactions have been constructed based on the STRING interactome (confidence score cut‐off = 900). The darker the colour, the greater the expression change. Node dimension directly correlates with the number of connections. An expanded view of panel F is available in supplementary material, Figure S3. GO, Gene Ontology; GO:CC, GO Cellular Component; GO:BP, GO Biological Process. (G and H) Representative images of cells labelled for GPR17 (magenta) and the synaptic protein VGluT2 (cyan) in the normal‐appearing tissue (NAT) and peri‐infarct (PI) area of post‐mortem human brain tissues from subjects affected by ischaemic stroke (scale bar: 30 μm). The cell branches in the dashed white boxes are magnified to highlight contacts between GPR17+ cells and VGluT2+ synapses, indicated by arrowheads (scale bar: 10 μm). (I–K) Representative images of VGluT2 labelling in the ischaemic core (IC) (I), PI area (J), and NAT (K). Scale bar: 100 μm. (L) Quantification of VGluT2‐positive area fraction in each region of interest (ROI), namely IC, PI area, and NAT, in post‐mortem human brain tissues from subjects affected by ischaemic stroke (n = 14). **p < 0.01, ****p < 0.0001, Kruskal–Wallis test followed by Dunn's post hoc analysis.

Similar articles

References

    1. Tsao CW, Aday AW, Almarzooq ZI, et al. Heart disease and stroke statistics‐2023 update: a report from the American Heart Association. Circulation 2023; 147: e93–e621. - PubMed
    1. Barthels D, Das H. Current advances in ischemic stroke research and therapies. Biochim Biophys Acta Mol Basis Dis 2020; 1866: 165260. - PMC - PubMed
    1. Marin MA, Carmichael ST. Mechanisms of demyelination and remyelination in the young and aged brain following white matter stroke. Neurobiol Dis 2019; 126: 5–12. - PubMed
    1. Cheng YJ, Wang F, Feng J, et al. Prolonged myelin deficits contribute to neuron loss and functional impairments after ischaemic stroke. Brain 2024; 147: 1294–1311. - PubMed
    1. Boda E, Viganò F, Rosa P, et al. The GPR17 receptor in NG2 expressing cells: focus on in vivo cell maturation and participation in acute trauma and chronic damage. Glia 2011; 59: 1958–1973. - PubMed

Publication types

MeSH terms

Substances