. 2024 Dec 5:15:1509342.
doi: 10.3389/fgene.2024.1509342. eCollection 2024.

BIRC5 as a prognostic and diagnostic biomarker in pan-cancer: an integrated analysis of expression, immune subtypes, and functional networks

Affiliations

BIRC5 as a prognostic and diagnostic biomarker in pan-cancer: an integrated analysis of expression, immune subtypes, and functional networks

Guoyu Li et al. Front Genet. .

Abstract

Introduction: BIRC5 (Survivin) is a crucial anti-apoptotic protein overexpressed in various cancers, promoting tumor growth and treatment resistance. This study investigates its expression across 33 cancer types and explores its diagnostic, prognostic, and immune-related significance.

Methods: We analyzed RNA-seq data from TCGA and protein expression data from the Human Protein Atlas. Expression levels were compared between tumor and normal tissues. Correlations with molecular and immune subtypes were explored using TISIDB. Prognostic significance was evaluated through survival analysis, Cox regression, and ROC curve analysis. The PPI network was constructed using STRING.

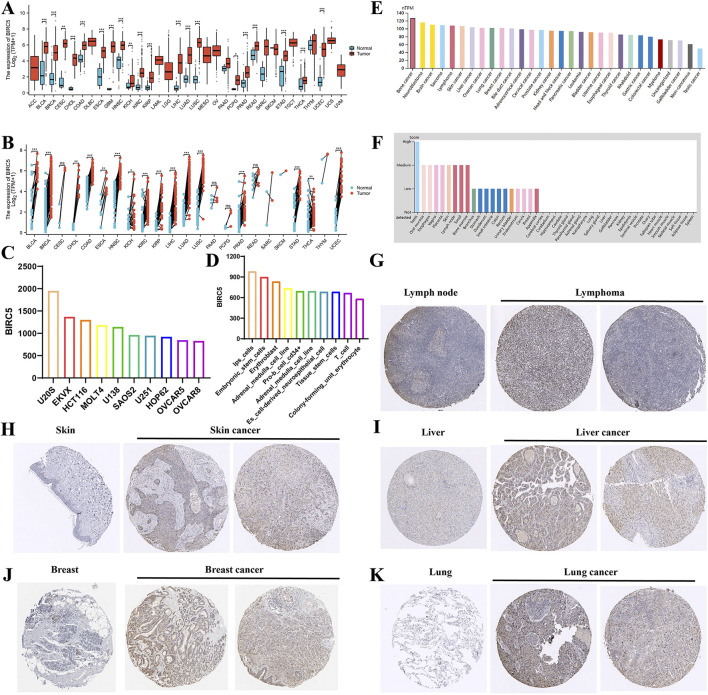
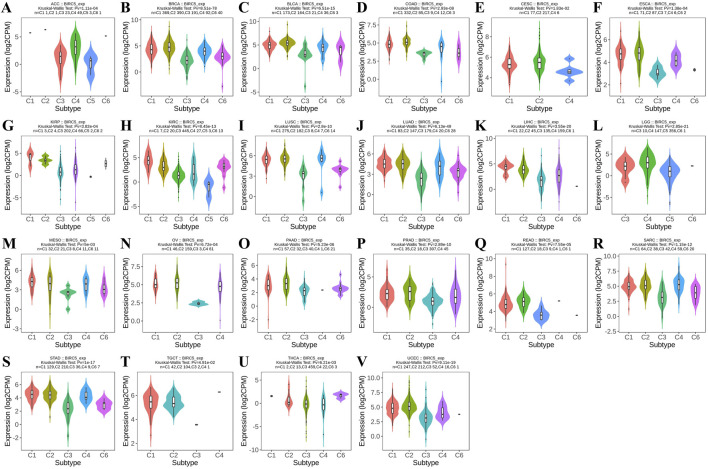
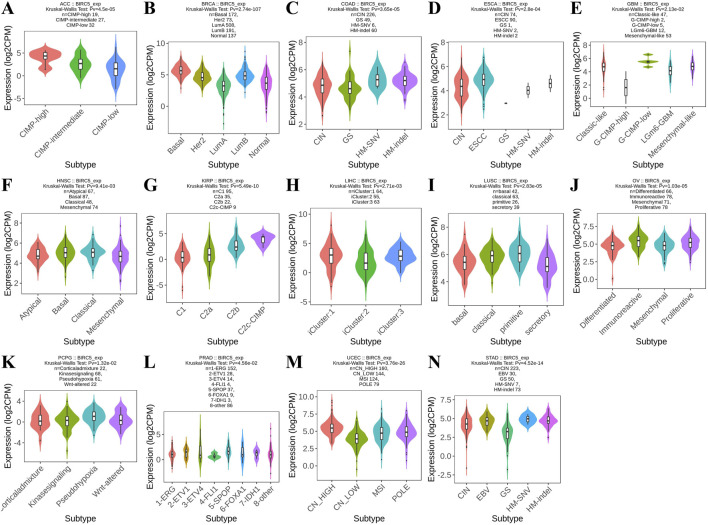
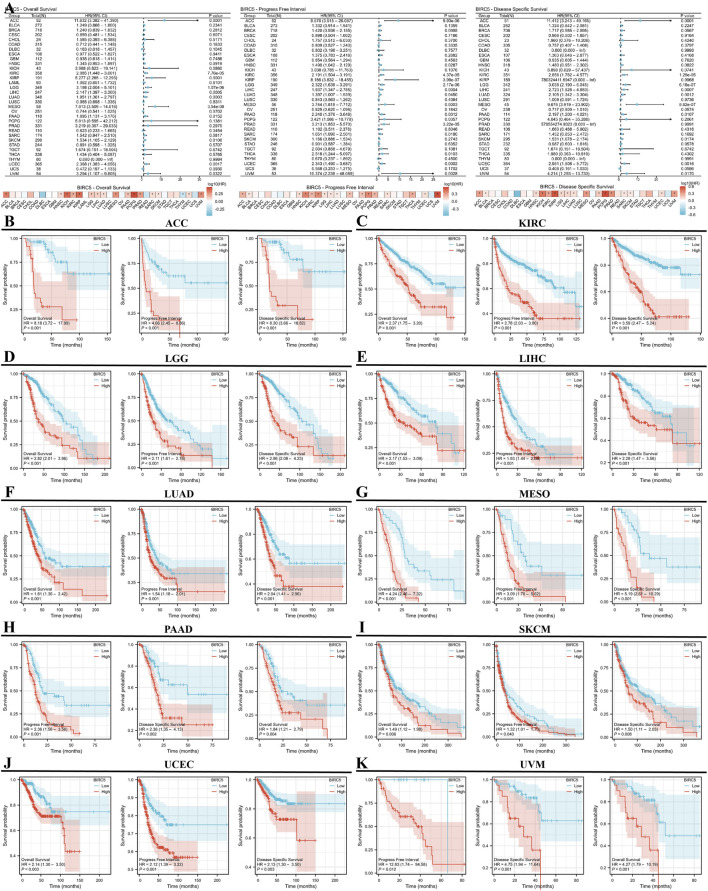
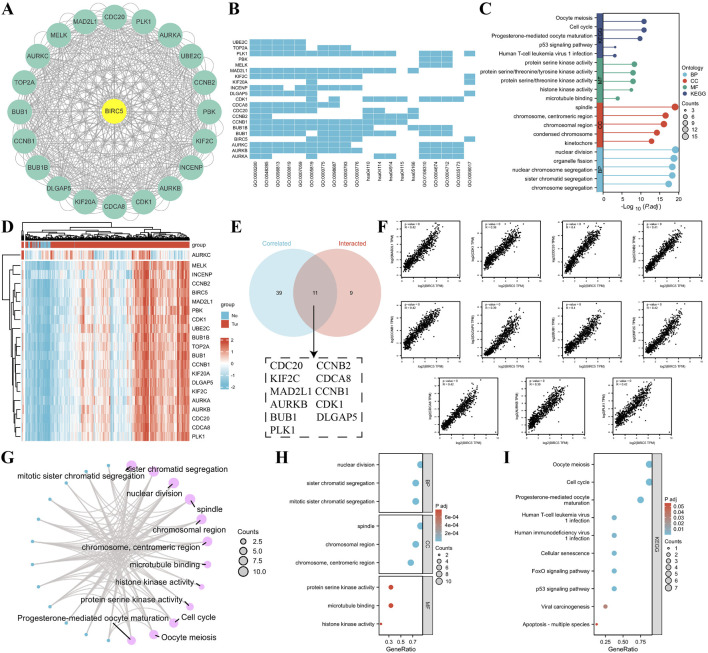
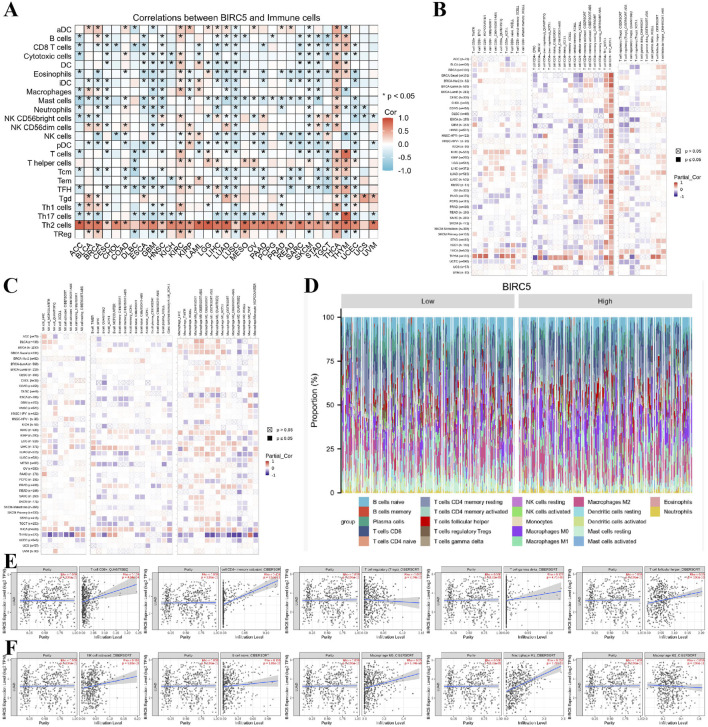
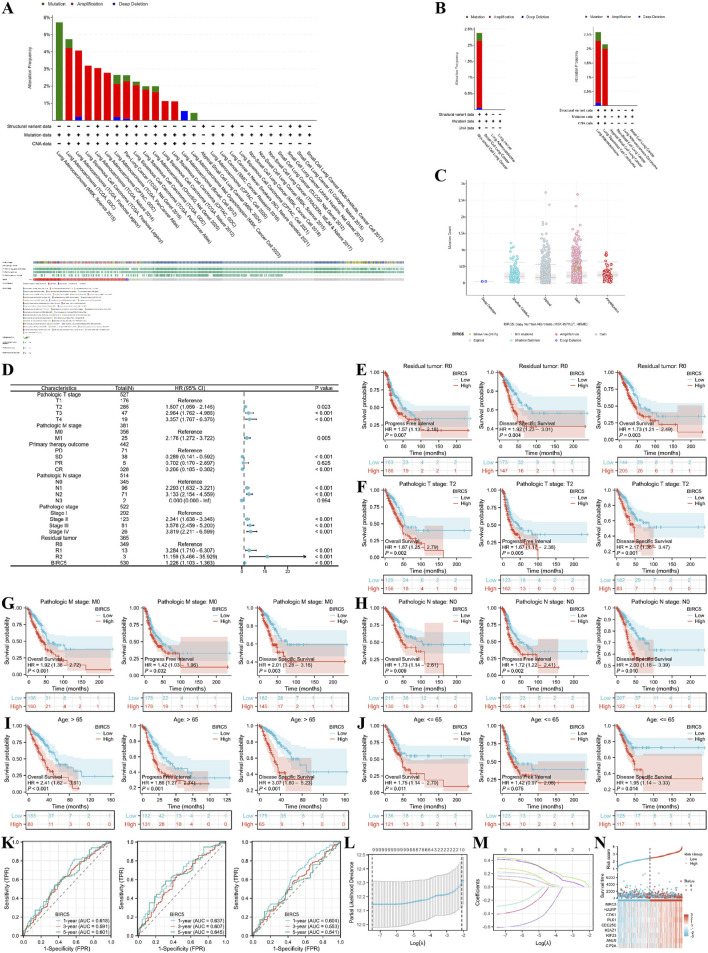
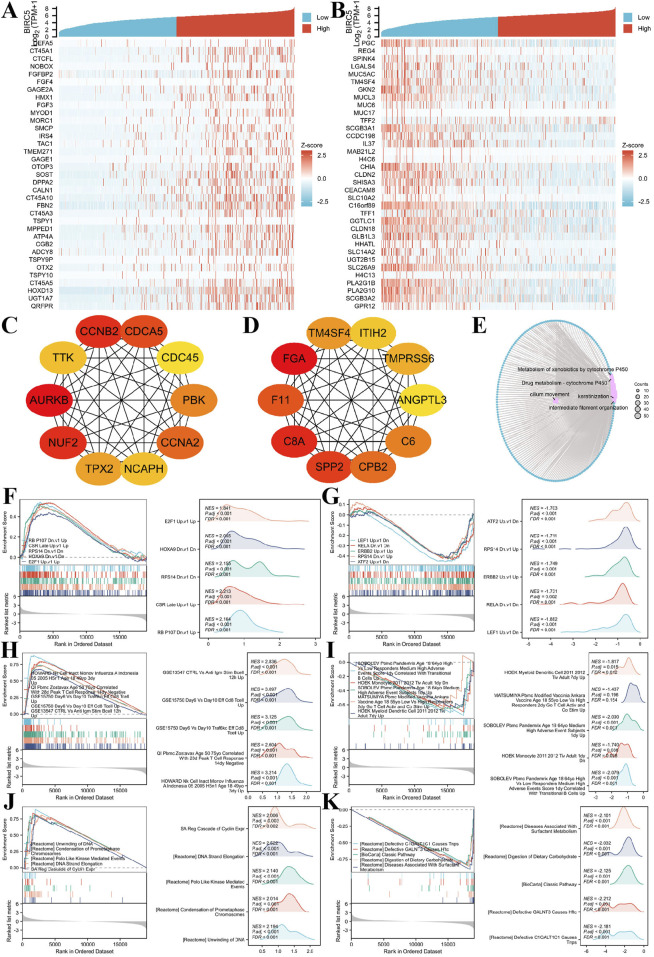
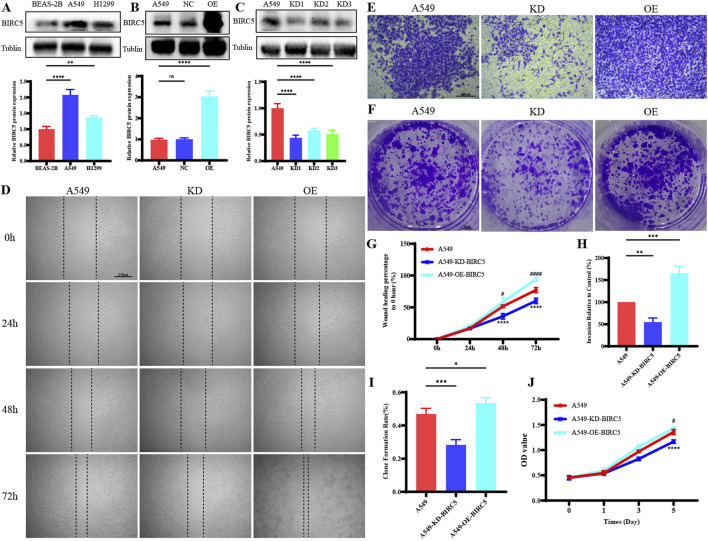
Results: BIRC5 was significantly overexpressed in tumor tissues across 33 cancer types, with higher expression levels observed in tumors compared to normal tissues. The protein expression analysis revealed a similar trend. BIRC5 expression was significantly correlated with various molecular and immune subtypes in multiple cancer types. Survival analysis indicated that high BIRC5 expression was associated with poor prognosis across multiple cancers, including lung adenocarcinoma (LUAD) and kidney renal clear cell carcinoma (KIRC). ROC analysis showed that BIRC5 exhibited strong diagnostic potential, with high AUC values (>0.9) in several cancers. The PPI network analysis identified key interacting proteins involved in the cell cycle and tumor progression, further supporting BIRC5's role in cancer biology. Functional experiments in lung adenocarcinoma (LUAD) revealed that BIRC5 upregulation enhances cell proliferation, migration, and invasion, while its knockdown suppresses these activities.

Discussion: BIRC5 is a promising diagnostic and prognostic biomarker in multiple cancers. Its association with immune subtypes suggests a potential role in the tumor immune microenvironment. These findings support BIRC5 as a therapeutic target for cancer treatment.

Keywords: BIRC5; cancer prognosis; diagnostic biomarker; lung adenocarcinoma; tumor immune microenvironment.


Conflict of interest statement

The authors declare that the research was conducted in the absence of any commercial or financial relationships that could be construed as a potential conflict of interest.

Figures

FIGURE 1
FIGURE 1
Differential analysis of BIRC5 expression in tumors and non-tumorous tissues. (A) BIRC5 mRNA expression in normal tissues and tumor cell lines (unpaired analysis). (B) BIRC5 mRNA expression in normal tissues and tumor cell lines (paired analysis). (C) BIRC5 mRNA expression in cancer cell lines. (D) BIRC5 mRNA expression in normal cell lines. (E) BIRC5 protein expression in tumor tissues from the HPA database. (F) BIRC5 protein expression in normal tissues from the HPA database. (G) BIRC5 expression in lymphoid tissues and lymphoid cancers. (H) BIRC5 expression in skin tissues and skin cancers. (I) BIRC5 expression in liver tissues and liver cancers. (J) BIRC5 expression in ovarian tissues and ovarian cancers. (K) BIRC5 expression in lung tissues and lung cancers (*p < 0.05, **p < 0.01, ***p < 0.001).
FIGURE 2
FIGURE 2
BIRC5 expression across different immunosubtypes in pan-cancer. (A) ACC, Adrenocortical Carcinoma; (B) BRCA, Breast Invasive Carcinoma; (C) BLCA, Bladder Urothelial Carcinoma; (D) COAD, Colon Adenocarcinoma; (E) CESC, Cervical Squamous Cell Carcinoma and Endocervical Adenocarcinoma; (F) ESCA, Esophageal Carcinoma; (G) KIRP, Kidney Renal Papillary Cell Carcinoma; (H) KIRC, Kidney Renal Clear Cell Carcinoma; (I) LUSC, Lung Squamous Cell Carcinoma; (J) LUAD, Lung Adenocarcinoma; (K) LIHC, Liver Hepatocellular Carcinoma; (L) LGG, Brain Lower Grade Glioma; (M) MESO, Mesothelioma; (N) OV, Ovarian Serous Cystadenocarcinoma; (O) PAAD, Pancreatic Adenocarcinoma; (P) PRAD, Prostate Adenocarcinoma; (Q) READ, Rectum Adenocarcinoma; (R) SARC, Sarcoma; (S) STAD, Stomach Adenocarcinoma; (T) TGCT, Testicular Germ Cell Tumors; (U) THCA, Thyroid Carcinoma; (V) UCEC, Uterine Corpus Endometrial Carcinoma (C1: wound healing, C2: IFN-gamma dominance, C3: inflammation, C4: lymphocyte depletion, C5: immune quiet, C6: TGF-b dominance), “Pv” refers to the p-value.
FIGURE 3
FIGURE 3
Analysis of BIRC5 molecular isoforms in pan-cancer. (A) ACC, Adrenocortical Carcinoma; (B) BRCA, Breast Invasive Carcinoma; (C) COAD, Colon Adenocarcinoma; (D) ESCA, Esophageal Carcinoma; (E) GBM, Glioblastoma Multiforme; (F) HNSC, Head and Neck Squamous Cell Carcinoma; (G) KIRP, Kidney Renal Papillary Cell Carcinoma; (H) LIHC, Liver Hepatocellular Carcinoma; (I) LUSC, Lung Squamous Cell Carcinoma; (J) OV, Ovarian Serous Cystadenocarcinoma; (K). PCPG, Pheochromocytoma and Paraganglioma; (L) PRAD, Prostate Adenocarcinoma; (M) UCEC, Uterine Corpus Endometrial Carcinoma; (N) STAD, Stomach Adenocarcinoma. “Pv” refers to the p-value.
FIGURE 4
FIGURE 4
Prognostic and disease progression analysis of BIRC5 in pan-cancer. (A) Forest plot and heatmap summarizing BIRC5’s prognostic value (OS, PFI, DSS); (B–I) Kaplan-Meier (KM) curves illustrating BIRC5 expression and prognosis across various cancer types (ACC, KIRC, LGG, LIHC, LUAD, MESO, PAAD, SKCM, UCEC, UVM).
FIGURE 5
FIGURE 5
ROC curves evaluating the predictive and prognostic relevance of BIRC5 expression across multiple cancer types.
FIGURE 6
FIGURE 6
Correlation and enrichment analysis of BIRC5-related genes and proteins. (A) PPI network showing the top 20 proteins interacting with BIRC5; (B–C) Heatmap and lollipop plot of GO and KEGG analysis of BIRC5-related proteins; (D) Heatmap of the top 50 genes correlated with BIRC5 in lung cancer; (E) Venn diagram showing the overlap between the top 50 genes associated with BIRC5 in lung cancer datasets and STRING-derived proteins interacting with BIRC5; (F) Eleven genes highly correlated with BIRC5; (G) Network diagram of GO and KEGG pathways associated with BIRC5 and the 11 genes; (H–I) Bubble plot of GO and KEGG analysis of BIRC5 and its interacting proteins.
FIGURE 7
FIGURE 7
BIRC5 expression is closely associated with immune cell infiltration in cancer. (A) Heatmap of BIRC5 expression and immune cell infiltration across pan-cancer. (B,C) Heatmap of BIRC5 expression and the infiltration of T cells, B cells, macrophages, and NK cells across pan-cancer. (D) Stratified analysis of BIRC5 expression and immune cell infiltration in lung cancer. (E,F) Correlation analysis of T cells, B cells, macrophages, NK cells, and BIRC5 gene expression in lung cancer.
FIGURE 8
FIGURE 8
Genomic alterations of BIRC5 in lung cancer and their correlation with prognosis across clinical subgroups. (A) OncoPrint of BIRC5 alterations in cancer cohorts; (B) Detailed breakdown of BIRC5 gene alterations in lung cancer; (C) Major types of BIRC5 alterations; (D) Forest plot summarizing BIRC5’s prognostic value in different clinical subgroups; (E–J) Kaplan-Meier (KM) curves showing BIRC5 expression, prognosis, and disease progression in lung cancer, stratified by clinical factors (age, residual tumor status, etc.); (K) Time-dependent ROC curve predicting 1, 3, and 5-year survival; (L,M) LASSO model results with cross-validation for tuning parameter selection and coefficient profiles; (N) Risk score, survival status, and heatmap of eight genes in lung cancer patients.
FIGURE 9
FIGURE 9
BIRC5 differential expression in lung cancer and functional enrichment analysis. (A–B) Heatmaps of the top 30 genes positively and negatively correlated with BIRC5 in lung cancer; (C–D). HUB genes positively and negatively correlated with BIRC5; (E). Network diagram of GO/KEGG analysis of BIRC5 co-expressed genes; (F–G) Visualization of GSEA results for BIRC5 co-expressed genes (oncogenic); (H–I) GSEA visualization of BIRC5 co-expressed genes in immunologic signatures; (J–K) GSEA visualization of BIRC5 co-expressed genes in gene ontology.
FIGURE 10
FIGURE 10
BIRC5 Affects Biological Functions in Lung Cancer (A) Protein expression of BIRC5 in normal lung epithelial cells and two lung cancer cell lines; (B) Detection of BIRC5 overexpression by Western blot analysis after transfection of BIRC5-specific or control oeRNA into A549 cells; (C) Detection of BIRC5 knockdown by Western blot analysis after transfection of BIRC5-specific into A549 cells; (D) Effect of BIRC5 on the migration ability of A549 cell; (E) Effect of IL20RB on the invasion ability of A549 cell; (F) Effect of BIRC5 on the proliferative capacity of A549 cells (plate clone); (G) Statistical analysis of cell migration ability results; (H) Statistical analysis of cell invasion ability results; (I) Statistical analysis of proliferative capacity results (plate clone); (J) Effect of BIRC5 on the proliferative capacity of A549 cells (CCK8).

References

    1. Ambeskovic A., McCall M. N., Woodsmith J., Juhl H., Land H. (2024). Exon-skipping-based subtyping of colorectal cancers. Gastroenterology 167 (7), 1358–1370.e12. 10.1053/j.gastro.2024.08.016 - DOI - PubMed
    1. Bai Z., Zhou Y., Ye X., Li Y., Peng Y., Guan Q., et al. (2022). Survivin suppression heightens BZML-induced mitotic catastrophe to overcome multidrug resistance by removing therapy-induced senescent A549/Taxol cells. Biochimica biophysica acta Mol. cell Res. 1869 (2), 119174. 10.1016/j.bbamcr.2021.119174 - DOI - PubMed
    1. Broodman I., VanDuijn M. M., Stingl C., Dekker L. J., Germenis A. E., de Koning H. J., et al. (2016). Survivin autoantibodies are not elevated in lung cancer when assayed controlling for specificity and smoking status. Cancer Immunol. Res. 4 (2), 165–172. 10.1158/2326-6066.CIR-14-0176 - DOI - PubMed
    1. Chandrasekaran A. P., Tyagi A., Poondla N., Sarodaya N., Karapurkar J. K., Kaushal K., et al. (2022). Dual role of deubiquitinating enzyme USP19 regulates mitotic progression and tumorigenesis by stabilizing survivin. Mol. Ther. J. Am. Soc. Gene Ther. 30 (11), 3414–3429. 10.1016/j.ymthe.2022.07.019 - DOI - PMC - PubMed
    1. Contini C., Manconi B., Olianas A., Guadalupi G., Schirru A., Zorcolo L., et al. (2024). Combined high-throughput proteomics and random forest machine-learning approach differentiates and classifies metabolic, immune, signaling and ECM intra-tumor heterogeneity of colorectal cancer. Cells 13 (16), 1311. 10.3390/cells13161311 - DOI - PMC - PubMed

LinkOut - more resources