. 2024 Dec 5:18:1446578.
doi: 10.3389/fnins.2024.1446578. eCollection 2024.

autoMEA: machine learning-based burst detection for multi-electrode array datasets

Affiliations

autoMEA: machine learning-based burst detection for multi-electrode array datasets

Vinicius Hernandes et al. Front Neurosci. .

Abstract

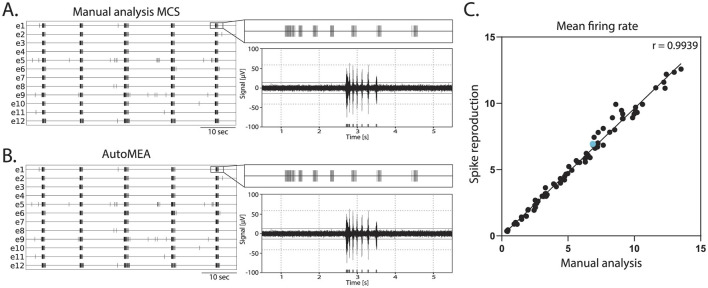
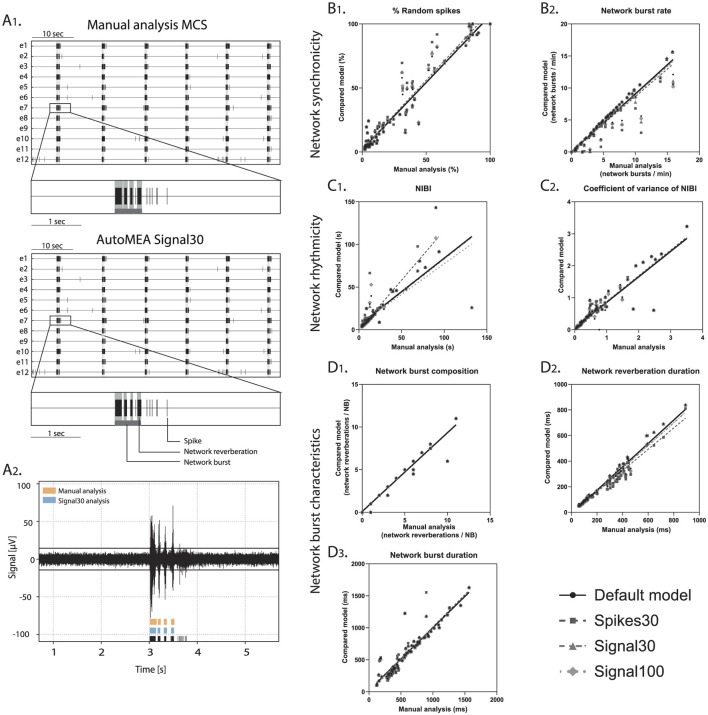
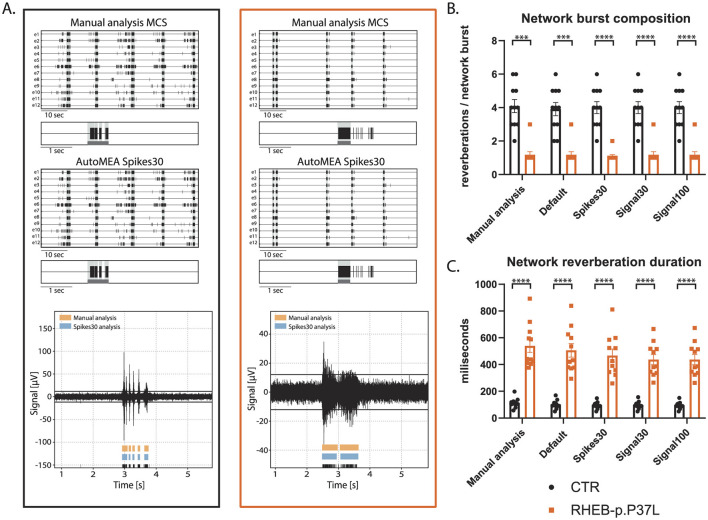
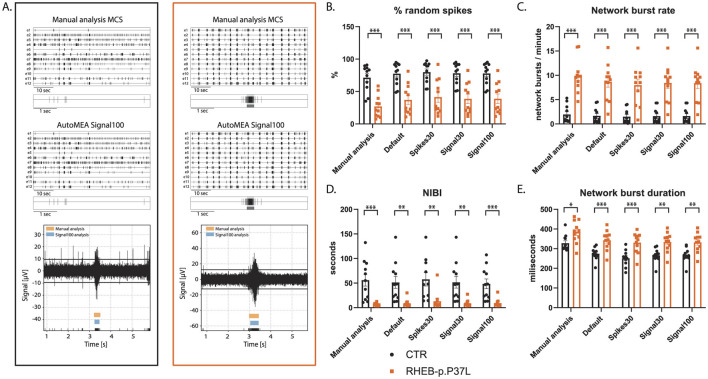
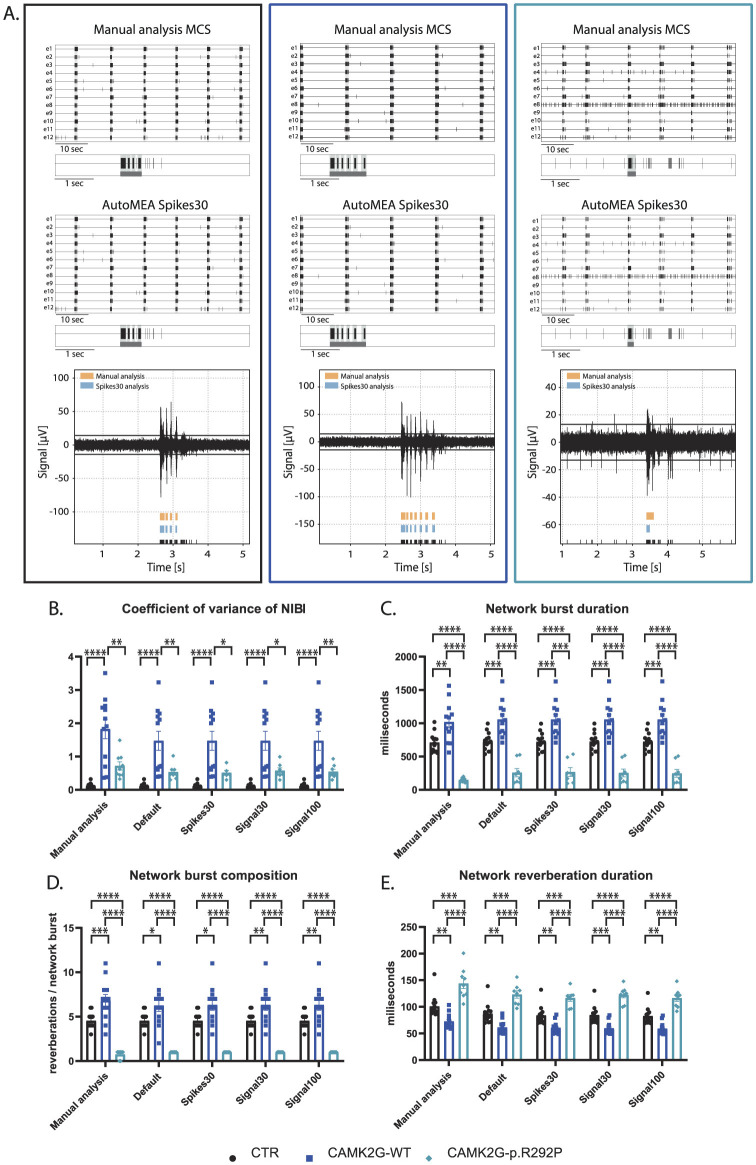
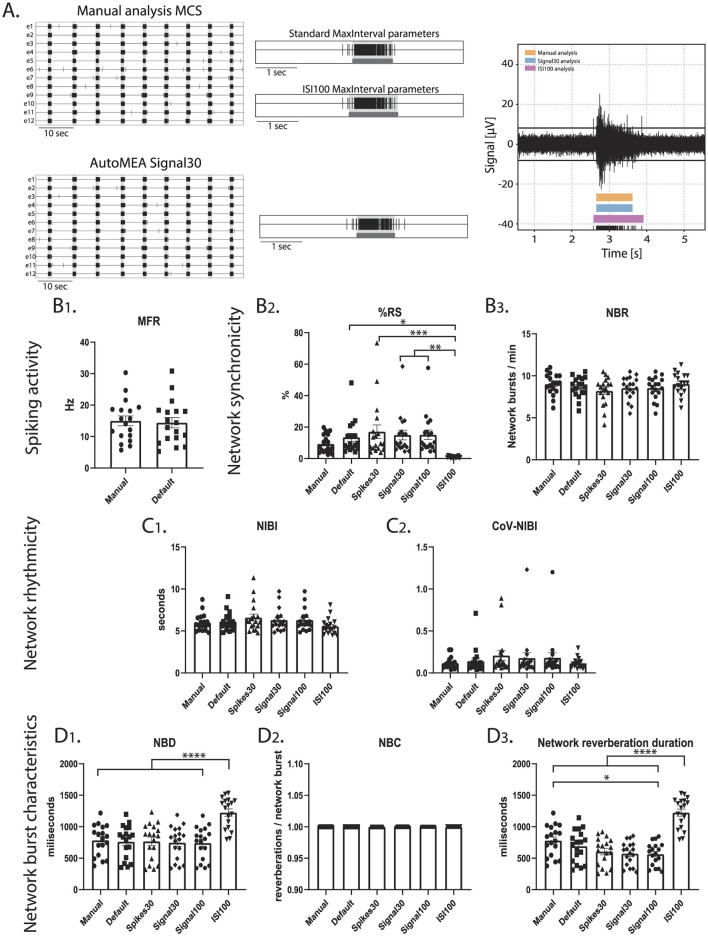
Neuronal activity in the highly organized networks of the central nervous system is the vital basis for various functional processes, such as perception, motor control, and cognition. Understanding interneuronal connectivity and how activity is regulated in the neuronal circuits is crucial for interpreting how the brain works. Multi-electrode arrays (MEAs) are particularly useful for studying the dynamics of neuronal network activity and their development as they allow for real-time, high-throughput measurements of neural activity. At present, the key challenge in the utilization of MEA data is the sheer complexity of the measured datasets. Available software offers semi-automated analysis for a fixed set of parameters that allow for the definition of spikes, bursts and network bursts. However, this analysis remains time-consuming, user-biased, and limited by pre-defined parameters. Here, we present autoMEA, software for machine learning-based automated burst detection in MEA datasets. We exemplify autoMEA efficacy on neuronal network activity of primary hippocampal neurons from wild-type mice monitored using 24-well multi-well MEA plates. To validate and benchmark the software, we showcase its application using wild-type neuronal networks and two different neuronal networks modeling neurodevelopmental disorders to assess network phenotype detection. Detection of network characteristics typically reported in literature, such as synchronicity and rhythmicity, could be accurately detected compared to manual analysis using the autoMEA software. Additionally, autoMEA could detect reverberations, a more complex burst dynamic present in hippocampal cultures. Furthermore, autoMEA burst detection was sufficiently sensitive to detect changes in the synchronicity and rhythmicity of networks modeling neurodevelopmental disorders as well as detecting changes in their network burst dynamics. Thus, we show that autoMEA reliably analyses neural networks measured with the multi-well MEA setup with the precision and accuracy compared to that of a human expert.

Keywords: automated analysis; burst detection; machine learning; multi-electrode array (MEA); neuronal network activity; reverberations.


Conflict of interest statement

The authors declare that the research was conducted in the absence of any commercial or financial relationships that could be construed as a potential conflict of interest.

Figures

Figure 1
Figure 1
Schematic depiction of our workflow. After collecting the raw MEA data, we feed them into three different workflows: we post-process the data either into the form of spikes or averaged signal (over 30 or 100 time bins). We follow by training the neural network specific to each of the inputs (these models are referred to as spikes30, signal30, and signal100) to output key parameters for the MaxInterval method: maximum interval to start and end the reverberations and minimal time between the reverberations. These parameters predicted by each machine learning model are then used for MaxInterval method that predicts the reverberations that are combined into bursts. An example of the plate type from Multichannel Systems, MCS GmbH, Reutlingen, Germany, used for experiments included in this study, is depicted in this figure.
Figure 2
Figure 2
Example of activity in primary hippocampal cultures. Top left: rasterplot with activity recorded on 12 electrodes with spikes indicated in black and network reverberations indicated with gray shading. Parameters random spike, bursts, and network bursts, IBI (inter-burst interval) and NIBI (network inter-burst interval) are indicated with boxes/lines in the raster. Bottom left: zoom in of the raw signal of a burst in one channel with spikes indicated in black, and reverberations and burst indicated in orange at the bottom. Right: raw signal of activity during a network burst. Bursts and reverberations detected on single channels are indicated in orange, overlaying light blue shade indicates detected network reverberations and the surrounding blue dotted line indicates the detected network burst.
Figure 3
Figure 3
Custom accuracy for three machine learning models: (A) spikes30, (B) signal30, and (C) signal100. The black and orange lines are the median of all custom accuracy values calculated for each epoch for the training and validation, respectively, and the shaded area is the range between the minimum and maximum values of custom accuracy for each epoch.
Figure 4
Figure 4
Burst quality metric for the parameter prediction models. (A) Three examples of bursts as presented for scoring to an experimenter. Raw signal of a burst with detected spikes indicated in black at the bottom and above the reverberations as detected by either the default method or one of the detection models (spikes30, signal30, signal100). During scoring, the experimenter was blind to which color represented the default and spikes30/signal30/signal100 detection, and color could switch with each presentation of a new burst. E.g., (A) (left) default in blue, spikes30 in orange, (middle) default in blue, signal100 in orange, (right) default in orange, signal100 in blue. (B–D) Burst quality score with the % of bursts scored as preferred with default method, with a predicted model, or equal for each method.
Figure 5
Figure 5
Correlation of the mean firing rate between spikes detected with manual analysis in MCS and autoMEA software. (A) Example raster plot (left) of spikes detected by MCS analysis with a zoom-in of the raster for a 5-s section above a 5-s section of the raw data (right). (B) Example raster plot (left) of spikes detected by the autoMEA software with a zoom-in of the raster for a 5-s section above a 5-s section of the raw data. (C) Mean firing rate in Hz, detected by manual analysis in MCS software on the x-axis, and autoMEA software on the y-axis. The correlation between the two detection methods is near-perfect. The blue dot is the datapoint presented in (A, B). N = 81 wells.
Figure 6
Figure 6
Validation of accurate parameter detection by the autoMEA models: (A) 1. examples of raster plots and 5-s sections of a single electrode as detected by the Manual analysis in MCS (top) or signal30 autoMEA software (bottom). Black lines represent spikes, light gray bars overlaying raster plot represent reverberations, dark gray bar at the bottom of the zoom section represents the network burst. 2. raw data example of a single channel during a network burst with reverberation detection presented at the bottom of the graph by manual analysis MCS in orange (top) and signal30 autoMEA analysis in blue (middle) and spikes in black (bottom). (B) Correlation between outcome for network synchronicity 1. % random spikes, 2. Network burst rate. (C) Correlation between outcome parameters for network rhythmicity 1. Network inter burst interval (NIBI), 2. Coefficient of variance of NIBI. (D) Correlation between outcome parameters for network burst characteristics 1. network burst composition, 2. network reverberation duration, 3. network burst duration. N = 81 wells.
Figure 7
Figure 7
Validation of the detection of epilepsy-related phenotypes in a DIV14 set of the RHEB-p.P37L NDD model by the autoMEA software: (A) example raster plots with a 5-s section of a single electrode of a control (black, left) and RHEB-p.P37L (orange, right) well from manual MCS analysis and the spikes30 autoMEA model, and a raw data trace example of a single channel during a network burst for both genotypes at the bottom, black lines at the bottom represent spikes, orange bars (top) represent reverberations as detected with manual MCS analysis and the blue bars (middle) reverberations detected using the spikes30 autoMEA model. (B) Comparison of the network burst composition for control and RHEB-p.P37L cultures detected using all different burst detection methods. (C) Comparison of the network reverberation duration for control and RHEB-p.P37L cultures detected using all different burst detection methods. N = 11 wells/group. Student's t-test: ***p < 0.0001, ****p < 0.00001.
Figure 8
Figure 8
Validation of the detection of epilepsy-related phenotypes in a DIV7 set of the RHEB-p.P37L NDD model by the autoMEA software: (A) example raster plots with a 5-s section of a single electrode of control (black, left) and RHEB-p.P37L (orange, right) well from manual MCS analysis and the signal100 autoMEA model, and a raw data trace example of a single channel during a network burst for both genotypes at the bottom, black lines at the bottom represent spikes, orange bars (top) represent reverberations as detected with manual MCS analysis and the blue bars (middle) reverberations detected using the signal100 autoMEA model. (B) Comparison of the %RS for control and RHEB-p.P37L cultures detected using all different burst detection methods. (C) Comparison of the network burst rate for control and RHEB-p.P37L cultures detected using all different burst detection methods. (D) Comparison of the NIBI for control and RHEB-p.P37L cultures detected using all different burst detection methods. (E) Comparison of the network burst duration for control and RHEB-p.P37L cultures detected using all different burst detection methods. N = 11 wells/group. Student's t-test: *p < 0.05, **p < 0.01, ***p < 0.001 ***p < 0.0001.
Figure 9
Figure 9
Validation of the detection of phenotypes in a DIV18 set of the CAMK2G-p.R292P NDD model by the autoMEA software: (A) example raster plots with a 5-s section of a single electrode of control (black, left) and CAMK2G-WT (dark blue, middle), and CAMK2G-p.R292P (light blue, right) well from manual MCS analysis and the spikes30 autoMEA model, and a raw data trace example of a single channel during a network burst for all genotypes at the bottom, black lines at the bottom represent spikes, orange bars (top) represent reverberations as detected with manual MCS analysis and the blue bars (middle) reverberations detected using the spikes30 autoMEA model. (B) Comparison of the %RS for control, CAMK2G-WT, and CAMK2G-p.R292P cultures detected using all different burst detection methods. (C) Comparison of the network burst rate for control, CAMK2G-WT, and CAMK2G-p.R292P cultures detected using all different burst detection methods. (D) Comparison of the NIBI for control, CAMK2G-WT, and CAMK2G-p.R292P cultures detected using all different burst detection methods. (E) Comparison of the network burst duration for control, CAMK2G-WT, and CAMK2G-p.R292P cultures detected using all different burst detection methods. N(control) = 13 wells, N(CAMK2G-WT) = 12, N(CAMK2G-p.R292P) = 12. One way ANOVA: *p < 0.05, **p < 0.01, ***p < 0.001 ***p < 0.0001, ****p < 0.00001.
Figure 10
Figure 10
Testing the performance of autoMEA burst detection on a cortical dataset. (A) Example raster plots with a 5-s section of a single electrode, analyzed using manual MCS analysis and the signal30 autoMEA model, and a raw data trace example of a single channel during a network burst for all genotypes at the bottom, black lines at the bottom represent spikes, orange bars (top) represent reverberations as detected with manual MCS analysis, the blue bars (middle) reverberations detected using the signal30 autoMEA models and the pink (bottom) the manual detection in MSC using ISI 100. (B) Comparison of the MFR, %RS, and NBR using all different burst detection methods. (C) Comparison of the NIBI and CoV-NIBI using all different burst detection methods. (D) Comparison of the NBD and NBC and network reverberation duration using all different burst detection methods. N = 18 wells. One way ANOVA: *p < 0.05, **p < 0.01, ***p < 0.001 ***p < 0.0001, ****p < 0.00001.

References

    1. Banker G., Goslin K. (1988). Developments in neuronal cell culture. Nature 336, 185–186. 10.1038/336185a0 - DOI - PubMed
    1. Bologna L. L., Pasquale V., Garofalo M., Gandolfo M., Baljon P. L., Maccione A., et al. . (2010). Investigating neuronal activity by spycode multi-channel data analyzer. Neur. Netw. 23, 685–697. 10.1016/j.neunet.2010.05.002 - DOI - PubMed
    1. Cabrera-Garcia D., Warm D., de la Fuente P., Fernández-Sánchez M. T., Novelli A., Villanueva-Balsera J. M. (2021). Early prediction of developing spontaneous activity in cultured neuronal networks. Sci. Rep. 11:20407. 10.1038/s41598-021-99538-9 - DOI - PMC - PubMed
    1. Cerina M., Piastra M. C., Frega M. (2023). The potential of in vitro neuronal networks cultured on micro electrode arrays for biomedical research. Progr. Biomed. Eng. 5:032002. 10.1088/2516-1091/acce12 - DOI
    1. Charlesworth P., Cotterill E., Morton A., Grant S. G., Eglen S. J. (2015). Quantitative differences in developmental profiles of spontaneous activity in cortical and hippocampal cultures. Neural Dev. 10, 1–10. 10.1186/s13064-014-0028-0 - DOI - PMC - PubMed

LinkOut - more resources