. 2024 Dec 5:14:1488017.
doi: 10.3389/fcimb.2024.1488017. eCollection 2024.

Fecal microbiota transplantation from postmenopausal osteoporosis human donors accelerated bone mass loss in mice

Affiliations

Fecal microbiota transplantation from postmenopausal osteoporosis human donors accelerated bone mass loss in mice

Tinglong Chen et al. Front Cell Infect Microbiol. .

Abstract

Objectives: To investigate the effect of gut microbiota from postmenopausal osteoporosis patients on bone mass in mice.

Methods: Fecal samples were collected from postmenopausal women with normal bone mass (Con, n=5) and postmenopausal women with osteoporosis (Op, n=5). Microbial composition was identified by shallow shotgun sequencing. Then fecal samples were transplanted into pseudo-sterile mice previously treated with antibiotics for 4 weeks. These mice were categorized into two groups: the Vehicle group (n=7) received fecal samples from individuals with normal bone mass, and the FMT group (n=7) received fecal samples from individuals with osteoporosis. After 8 weeks, bone mass, intestinal microbial composition, intestinal permeability and inflammation were assessed, followed by a correlation analysis.

Results: The bone mass was significantly reduced in the FMT group. Microbiota sequencing showed that Shannon index (p < 0.05) and Simpson index (p < 0.05) were significantly increased in Op groups, and β diversity showed significant differences. the recipient mice were similar. linear discriminant analysis effect size (LEfSe) analysis of mice showed that Halobiforma, Enterorhabdus, Alistipes, and Butyricimonas were significantly enriched in the FMT group. Lachnospiraceae and Oscillibacter were significantly enriched in the Vehicle group. H&E staining of intestinal tissues showed obvious intestinal mucosal injury in mice. Intestinal immunohistochemistry showed that the expression of Claudin and ZO-1 in the intestinal tissue of the FMT group mice was decreased. The FITC-Dextran (FD-4) absorption rate and serum soluble CD14 (sCD14) content were increased in FMT mice. Correlation analysis showed that these dominant genera were significantly associated with bone metabolism and intestinal permeability, and were associated with the enrichment of specific enzymes. Serum and bone tissue inflammatory cytokines detection showed that the expression of TNF-α and IL-17A in the FMT group were significantly increased.

Conclusion: Overall, our findings suggested gut microbiota from postmenopausal osteoporosis patients accelerate bone mass loss in mice. Aberrant gut microbiota might play a causal role in the process of bone mass loss mediated by inflammation after the destruction of the intestinal barrier.

Keywords: fecal microbiota transplantation; gut microbiota; inflammation; intestinal permeability; osteoporosis.


Conflict of interest statement

The authors declare that the research was conducted in the absence of any commercial or financial relationships that could be construed as a potential conflict of interest.

Figures

Figure 1
Figure 1
Operation flow chart and basic information in mice. (A) Overall schematic representation of fecal microbiota transplantation. C57BL/6J mice were acclimated for 1 week followed by oral administration of antibiotics for 2 weeks followed by oral inoculation with prepared fecal contents from two different populations (Con, Op). After successful colonization of the gut microbiome, feces, bone tissues, intestinal tissues, and inflammation were collected for further analysis. (B) Colony counts of mice before and after ABX treatment showed significant differences before and after antibiotic treatment in mice. (C) Weight growth curves of mice in each group. (D) The weight gain of mice in both groups, and the difference between the two groups was significant, * stands for P<0.05, ** stands for P<0.01, and *** stands for P<0.001. (B–D) Independent-Samples t-test.
Figure 2
Figure 2
Micro-CT and bone tissue parameters in mice. (A) Micro-CT image of the trabecular bone structure of the distal femur. The scale bar represents 0.4mm. (B) Common bone parameters of mouse femurs. Including bone mineral density (BMD), bone volume (BV), and bone volume fraction (BV/TV). (C) Trabecular bone parameters of the femur in mice. Including the number of trabecular bone (Tb. N), the average thickness of trabecular bone (Tb. Th), and trabecular bone separation (Tb. Sp). (D) Cortical bone parameters. Cortical bone thickness (Ct. Th), cortical bone area (Ct. Ar), and the ratio of cortical bone area to total bone area (Ct. Ar/Tt. Ar). * stands for P<0.05, and ** stands for P<0.01. (B-D) Independent-Samples t-test.
Figure 3
Figure 3
Bone metabolism-related assays and staining. (A) Representative H&E stained picture of the proximal femoral region, scale bar 400μm. (B) The concentrations of serum CTX-I were detected by ELISA. (C) Representative picture and quantification of TRAP staining in the proximal femoral region, red is TRAP staining positive cells. (D) Representative picture of OCN staining, brown is osteocalcin positive staining cells. * stands for P<0.05. (B–D) Independent-Samples t-test.
Figure 4
Figure 4
Characteristics of gut microbiota in donor postmenopausal women. (A) Stacked bar plots of relative abundance at the phylum level. (B) Stacked bar plots of relative abundance at the genus level. (C) Principal component analysis. The abscissa represents the first principal component, the ordinate represents the second principal component, and the percentage represents the contribution to the sample variance. Each point represents a sample. (D-G) The alpha diversity of intestinal flora in the two groups was described according to ACE index, Chao1 index, Shannon index, and Simpson index. Con, normal bone mass control; Op, postmenopausal osteoporosis group. ns, no statistical difference, ** stands for P<0.01. (D–G), Independent-Samples t-test.
Figure 5
Figure 5
Characteristics of gut microbiota in recipient mice. (A) Venn diagram comparing the shared number in gut microbiome of human donors (n = 5 for Con, n = 5 for Op) and recipient mice (n = 7 for Vehicle, n = 7 for FMT) at the genus level. (B) Stacked bar plot of relative abundance at the genus level, with a significant difference in red between Vehicle and FMT groups. (C-F) Alpha diversity of gut microbiota including ACE index, Chao1 index, Shannon index, and Simpson index. (G) The β diversity of the two groups was represented by principal component analysis. * stands for P<0.05. (C–F), Independent-Samples t-test.
Figure 6
Figure 6
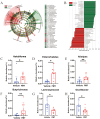
Analysis of differences in bacterial flora structure at the genus level in mice. (A) The Least discriminant analysis (LDA) effect size taxonomic cladogram, with radiation circles from inside to outside indicating taxonomic level from phylum to species. Each small circle represents a classification at that level, and the diameter of the small circle is proportional to the corresponding relative abundance. Where yellow is the species with no significant difference, red nodes represent the microbiome that plays an important role in the Vehicle group. Green nodes represent the microbiome that plays an important role in the FMT group. The species names represented by the English letters in the figure are shown on the right. (B) Histogram of LDA value distribution showing statistical differences (LDA score>3.5). The histogram length indicates the effect of different species (LDA score). (C-H) At the genus level, six dominant bacteria were significantly enriched in the FMT group with statistical differences and biological significance. * stands for P<0.05, and ** stands for P<0.01. (B–H), Kruskal-Wallis test and paired Wilcoxon rank-sum test.
Figure 7
Figure 7
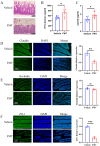
Recipient mice showed increased intestinal permeability. (A) H&E staining of ileal tissues. In the FMT group, the villi were arranged disorderly, swelling was obvious, and the intestinal epithelial barrier was damaged. (B, C) The concentrations of serum LPS and sCD 14 were detected by ELISA. (D-F) The Claudin, Occludin, and ZO-1 immunohistochemical staining and quantification of ileum tissue sections. The scale bar was 50μm. * stands for P<0.05, ** stands for P<0.01, and *** stands for P<0.001. (B-F), Independent-Samples t-test.
Figure 8
Figure 8
Functional analysis and correlation analysis. (A) Correlation between dominant bacteria and bone tissue parameters. (B) PCA plot, comparing the classification profiles of enzymes in all samples of the two groups of mice. (C) Differentially expressed enzymes between the two groups by STAMP analysis. Each bar on the left represents the mean value of each enriched enzymes in each group with significant differences. Differences between the confidence levels of the groups are shown on the right. The two ends of each circle in the figure indicate the upper and lower 95% confidence intervals of the mean differences. The center of the circle indicates the difference in the means. (Corrected P value < 0.05 is defined as a significant difference. Orange, Vehicle; Blue, FMT. Red indicates significantly enriched enzymes in the FMT group.). (D) Correlation between dominant bacteria and enriched pathways. * stands for P<0.05, and ** stands for P<0.01. Correlations analysis were performed by Spearman Analysis.
Figure 9
Figure 9
Biochemical changes in blood and bone after microbiota transplantation. (A, B) Immunofluorescence staining and quantification of TNF-α and IL-17A in the proximal femur of mice. TNF-α+ or IL-17A+ cells are shown in red, nuclei are shown in blue DAPI, scale bars 100 μm. (C, D) ELISA for mice serum TNF-α and IL-17A. (E) Fasting blood glucose of mice. ** stands for P<0.01, and *** stands for P<0.001. (B–E), Independent-Samples t-test.

References

    1. Adeel S., Singh K., Vydareny K. H., Kumari M., Shah E., Weitzmann M. N., et al. . (2013). Bone loss in surgically ovariectomized premenopausal women is associated with T lymphocyte activation and thymic hypertrophy. J. Investig. Med. 61, 1178–1183. doi: 10.2310/JIM.0000000000000016 - DOI - PMC - PubMed
    1. Akhter M. P., Lappe J. M., Davies K. M., Recker R. R. (2007). Transmenopausal changes in the trabecular bone structure. Bone 41, 111–116. doi: 10.1016/j.bone.2007.03.019 - DOI - PubMed
    1. Barron R. L., Oster G., Grauer A., Crittenden D. B., Weycker D. (2020). Determinants of imminent fracture risk in postmenopausal women with osteoporosis. Osteo. Int. 31, 2103–2111. doi: 10.1007/s00198-020-05294-3 - DOI - PMC - PubMed
    1. Becattini S., Taur Y., Pamer E. G. (2016). Antibiotic-induced changes in the intestinal microbiota and disease. Trends Mol. Med. 22, 458–478. doi: 10.1016/j.molmed.2016.04.003 - DOI - PMC - PubMed
    1. Benakis C., Brea D., Caballero S., Faraco G., Moore J., Murphy M., et al. . (2016). Commensal microbiota affects ischemic stroke outcome by regulating intestinal γδ T cells. Nat. Med. 22, 516–523. doi: 10.1038/nm.4068 - DOI - PMC - PubMed

Substances