. 2024 Dec 18;6(4):zcae046.
doi: 10.1093/narcan/zcae046. eCollection 2024 Dec.

Spatial transcriptomics in breast cancer reveals tumour microenvironment-driven drug responses and clonal therapeutic heterogeneity

Affiliations

Spatial transcriptomics in breast cancer reveals tumour microenvironment-driven drug responses and clonal therapeutic heterogeneity

María José Jiménez-Santos et al. NAR Cancer. .

Abstract

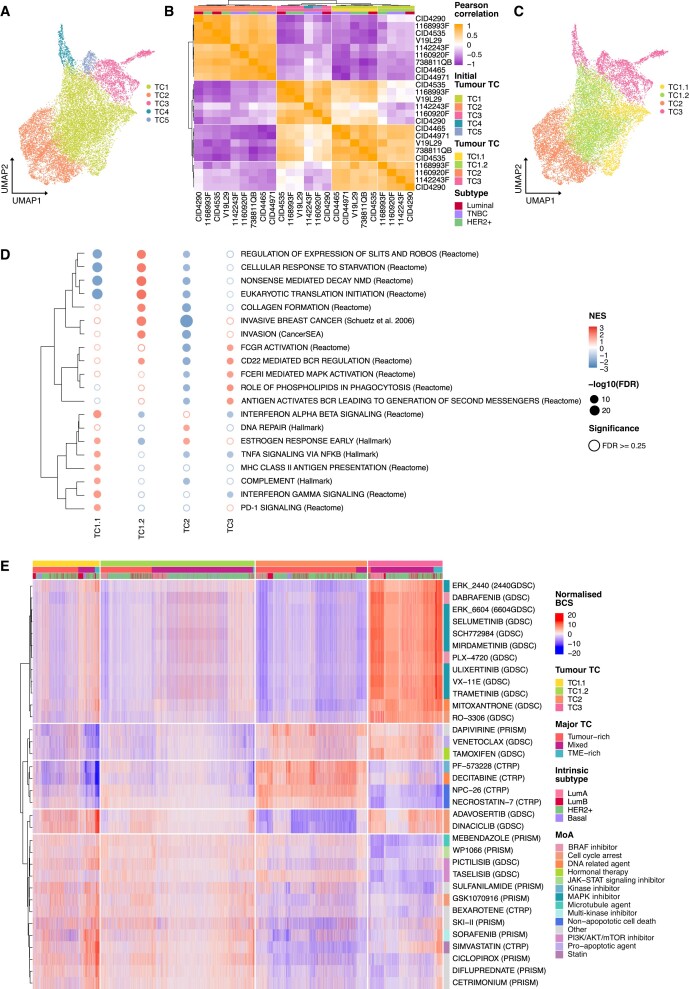
Breast cancer patients are categorized into three subtypes with distinct treatment approaches. Precision oncology has increased patient outcomes by targeting the specific molecular alterations of tumours, yet challenges remain. Treatment failure persists due to the coexistence of several malignant subpopulations with different drug sensitivities within the same tumour, a phenomenon known as intratumour heterogeneity (ITH). This heterogeneity has been extensively studied from a tumour-centric view, but recent insights underscore the role of the tumour microenvironment in treatment response. Our research utilizes spatial transcriptomics data from breast cancer patients to predict drug sensitivity. We observe diverse response patterns across tumour, interphase and microenvironment regions, unveiling a sensitivity and functional gradient from the tumour core to the periphery. Moreover, we find tumour therapeutic clusters with different drug responses associated with distinct biological functions driven by unique ligand-receptor interactions. Importantly, we identify genetically identical subclones with different responses depending on their location within the tumour ducts. This research underscores the significance of considering the distance from the tumour core and microenvironment composition when identifying suitable treatments to target ITH. Our findings provide critical insights into optimizing therapeutic strategies, highlighting the necessity of a comprehensive understanding of tumour biology for effective cancer treatment.


Figures

Graphical Abstract
Graphical Abstract
Figure 1.
Figure 1.
Tumour and TME dissection in ST breast cancer samples. (A) Schematic representation of the analysis workflow followed to label each spot as either tumour or TME. (B) Venn diagram representing the overlapping between the four annotation sources used to label tumour spots. An example tissue slide containing three regions coloured by (C) pathologist annotations, (D) scaled ESTIMATE score, which is inversely proportional to the tumour purity, (E) cancer cell proportions and (F) clonal structure of the tumour. (G) Final tumour and TME labelling based on all previous annotations, as summarized in panel (A). TME, tumour microenvironment; ST, spatial transcriptomics; ESTIMATE, Estimation of STromal and Immune cells in MAlignant Tumours using Expression data; TNBC, triple-negative breast cancer; HER2+, human epidermal growth factor receptor 2 positive; SCEVAN, Single CEll Variational Aneuploidy aNalysis; CNA, copy-number alteration; DCIS, ductal carcinoma in situ.
Figure 2.
Figure 2.
Spatial compartmentalization of drug response in the tumour ecosystem. (A) UMAP projection of spots from nine breast cancer patients clustered by their predicted sensitivity to the SSc breast. The same projection is coloured by TC (left), tumour or TME labels (centre) and major TC (right). (B) Proportion of tumour and TME spots in each TC, coloured by major TC. The proportion of tumour spots was at least 95% in tumour-rich TCs, greater than 65%, less than 80% in mixed TCs, and 15% or less in TME-rich TCs. (C) Proportion of the three major TCs across all patients. (D) Neighbourhood enrichment between the spots defining each major TC’s edge. A z-score > 0 indicates that the spots of two categories co-localize more than expected by chance, whereas a z-score < 0 indicates a repellant effect between categories. Mean z-scores are computed to aggregate the information coming from all patients. (E) Spatial projection of the three major TCs on top of tissue slides from different breast cancer subtypes. (F) Correlation heatmap between the mean BCS of tumour and TME-rich compartments across all patients. Pearson correlation coefficients are clustered using Ward’s method. UMAP, Uniform Manifold Approximation and Projection; SSc breast, breast sensitivity signature collection; TC, therapeutic cluster; TME, tumour microenvironment; BCS, Beyondcell Score; TNBC, triple-negative breast cancer; HER2+, human epidermal growth factor receptor 2 positive.
Figure 3.
Figure 3.
A functional and drug sensitivity gradient exists between the tumour and TME compartments. (A) Proportion of cell types in each major TC across all patients. We labelled tumour spots as cancer cells and assigned TME spots to the non-malignant cell type with maximum deconvoluted proportion. Spatial projection of (B) breast cancer subtype biomarkers, (C) drug sensitivity, (D) functional BCS and (E) the radial distances to the tumour core on top of patient CID44971 (TNBC) slide. To help visualization, we plot the square root of radial distances multiplied by the original sign. (F) Region-wise Pearson correlation coefficients between radial distances and functional (top) or sensitivity (bottom) BCS. Anticorrelated signatures are more enriched in spots closer to the tumour core. Correlated signatures are more enriched in the regions farthest away from the centre of the tumoural mass. The P-values were adjusted using FDR correction for multiple testing (*FDR < 0.05). TME, tumour microenvironment; TC, therapeutic cluster; BCS, Beyondcell Score; TNBC, triple-negative breast cancer; FDR, false discovery rate, CAF, cancer-associated fibroblasts; PVL, perivascular-like cell; ESR1, Oestrogen Receptor gene; PGR, Progesterone Receptor gene; ERBB2, Erb-B2 Receptor Tyrosine Kinase 2 gene; TLS, tertiary lymphoid structure; TIS. tumour inflammation signature; ECM, extracellular matrix; EMT, epithelial-to-mesenchymal transition; HER2+, human epidermal growth factor receptor 2 positive; anti-inflamm., anti-inflammatory; Immunosupp., immunosuppressor.
Figure 4.
Figure 4.
The interaction with the TME influences cancer drug response. (A) UMAP projection of tumour spots clustered by their predicted sensitivity to the SSc breast, coloured by initial TC. (B) Correlation heatmap between the mean BCS of tumour TCs across all patients. Pearson correlation coefficients are clustered using Ward’s method. Initial tumour TCs were refined into TC1.1, TC1.2, TC2 and TC3. (C) The same projection as in panel (A), coloured by refined tumour TCs. (D) Bubble heatmap depicting significantly positively enriched pathways in each tumour TC, as identified by differential gene expression analysis and pre-ranked GSEA. Rows represent functional pathways, and columns represent the tumour TCs. The colour of the bubble is proportional to the NES magnitude and the size of the bubble to the FDR-adjusted P-value. Empty bubbles represent non-significant results (FDR ≥ 0.25). Rows are clustered according to the Euclidean distance between NES. (E) Heatmap of drugs that specifically target the tumour TCs. Drugs are clustered according to their BCS using Ward’s method and labelled by MoA. Spots from all samples are ordered by tumour TC, major TC, and the intrinsic subtype, which is determined using single-cell PAM50 signatures derived from Wu et al. TME, tumour microenvironment; UMAP, Uniform Manifold Approximation and Projection; SSc breast, breast sensitivity signature collection; TC, therapeutic cluster; BCS, Beyondcell Score; GSEA, gene set enrichment analysis; NES, Normalized Enrichment Score; FDR, false discovery rate; MoA, mechanism of action; TNBC, triple-negative breast cancer; HER2+, human epidermal growth factor receptor 2 positive; LumA, Luminal A; LumB, Luminal B.
Figure 5.
Figure 5.
Subclones display heterogeneous responses depending on their location in tumoural ROIs. Spatial projection of (A) ROIs, (B) tumour subclones and (C) tumour TCs on top of patient V19L29 (HER2+) tissue slides. (D) Sankey diagram outlining spots' ROI, subclone and tumour TC membership. (E) Barplots depicting the different TC compositions between the edge and inner regions of each subclone and ROI. Differences in proportions were tested with a Fisher’s exact test. The P-values were adjusted using FDR correction for multiple testing (ns FDR ≥ 0.05, *FDR < 0.05, **FDR < 0.01, ***FDR < 0.001, ****FDR < 0.0001). Spatial projection of (F) the CNAs and (G) the expression for ERBB2 biomarker, (H) the predicted sensitivity to the HER2 inhibitor varlitinib and (I) the predicted sensitivity to doxorubicin. This patient constitutes an example of pre-existent treatment resistance and the usefulness of dissecting ITH for therapy design. A combination of varlitinib and doxorubicin would target both HER2+ and HER2− cancer cells to eliminate the tumour and avoid relapse. ROI, region of interest; TC, therapeutic cluster; HER2+, human epidermal growth factor receptor 2 positive; FDR, false discovery rate; ns, not significant; CNA, copy-number alterations; ERBB2, Erb-B2 Receptor Tyrosine Kinase 2 gene; ITH, intratumour heterogeneity; SC, subclone; BCS, Beyondcell Score.

References

    1. Duffy M.J., Crown J. A personalized approach to cancer treatment: how biomarkers can help. Clin. Chem. 2008; 54:1770–1779. - PubMed
    1. Burrell R.A., McGranahan N., Bartek J., Swanton C. The causes and consequences of genetic heterogeneity in cancer evolution. Nature. 2013; 501:338–345. - PubMed
    1. Wahida A., Buschhorn L., Fröhling S., Jost P.J., Schneeweiss A., Lichter P., Kurzrock R. The coming decade in precision oncology: six riddles. Nat. Rev. Cancer. 2023; 23:43–54. - PubMed
    1. Jiménez-Santos M.J., García-Martín S., Fustero-Torre C., Di Domenico T., Gómez-López G., Al-Shahrour F. Bioinformatics roadmap for therapy selection in cancer genomics. Mol. Oncol. 2022; 16:3881–3908. - PMC - PubMed
    1. Wu S.Z., Al-Eryani G., Roden D.L., Junankar S., Harvey K., Andersson A., Thennavan A., Wang C., Torpy J.R., Bartonicek N. et al. . A single-cell and spatially resolved atlas of human breast cancers. Nat. Genet. 2021; 53:1334–1347. - PMC - PubMed

LinkOut - more resources