. 2024 Dec 4:15:1448107.
doi: 10.3389/fendo.2024.1448107. eCollection 2024.

Loss of Sult1a1 reduces body weight and increases browning of white adipose tissue

Affiliations

Loss of Sult1a1 reduces body weight and increases browning of white adipose tissue

Margherita Springer et al. Front Endocrinol (Lausanne). .

Abstract

Background and objective: Overweight and obesity affects millions of individuals worldwide and consequently represents a major public health concern. Individuals living with overweight and obesity have difficulty maintaining a low body weight due to known physiological mechanisms which prevent further weight loss and drive weight regain. In contrast, mechanisms which promote low body weight maintenance receive less attention and are largely unknown. To uncover these intrinsic mechanisms, we investigated a human cohort of constitutionally thin (CT) individuals which maintain a low body weight and are resistant to weight gain despite exposure to an obesogenic environment.

Methods: To identify novel genes that contribute to low body weight maintenance, we performed transcriptomics on adipose tissue biopsies collected from CT and normal body weight (NBW) individuals and identified sulfotransferase 1A1 (SULT1A1) as a target for further investigation in mice. Sult1a1 knockout (KO) mice were fed a standard diet to assess the impact of Sult1a1 deletion on metabolic traits. To determine if high-fat feeding recapitulated the CT weight gain resistance phenotype, Sult1a1 KO mice were fed a high-fat diet for 13-weeks. A subset of wild-type and Sult1a1 KO mice from the standard diet were further analyzed for characterization of adipose tissue respiratory capacity.

Results: In comparison to NBW controls, adipose tissue from CT individuals expresses less SULT1A1. Sult1a1 KO mice weigh 10% less at the end of the study period and on a high-fat diet, Sult1a1 KO mice tended to gain less weight and had reduced fat mass at 14-weeks of age. These changes were associated with reduced fasting insulin and lessened adipose tissue inflammation and fibrosis. Subcutaneous adipose tissue from Sult1a1 KO mice on a standard chow diet had elevated leak respiration, uncoupling protein 1 (UCP1) expression and increased expression of a mitochondrial marker, VDAC, associating Sult1a1 deletion to adipose tissue browning.

Conclusions: Our results associate Sult1a1 deletion with a tendency for lower body weight through remodeling of white adipose tissue towards a brown phenotype. The presence of UCP1, the expression of an additional mitochondrial protein and increased respiratory capacity suggest browning of the subcutaneous adipose tissue depot of Sult1a1 KO mice.

Keywords: browning; leanness; obesity; sulfotransferase 1A1; white adipose tissue.


Conflict of interest statement

Author MS was employed and author JH is employed by the company Société des Produits Nestlé S.A. KSH is the founder of Maven Health. The remaining authors declare that the research was conducted in the absence of any commercial or financial relationships that could be construed as a potential conflict of interest.

Figures

Figure 1
Figure 1
Reduced expression of SULT1A1 in the adipose tissue of CT individuals. (A) Volcano plot enabling visualization of differentially expressed probesets with a q-value<0.05 between CT (n =6) and normal body weight individuals (n=6). Dashed lines help to visualize the thresholds corresponding to our statistical analysis and represent a log2 fold change (≥|0.38|) and a -log10 p-values ≥ 1.05.10-4. Grey dots represent transcripts that are not significantly differentially expressed. Black dots are transcripts that are differentially expressed by not statistically significant. Red dots are transcripts that are differentially expressed and statistically significant. (B) Expression of selected differentially expressed transcripts by qPCR from RNA collected from CT and normal body weight individuals shown in Figure 1 , (A) p values were calculated using an unpaired Student’s t test *p ≤ 0.05 and **p ≤ 0.01 (C) Data obtained from the Common Metabolic Disease Knowledge Portal associating SULT1A1 variants with metabolic phenotypes. Top most significant associations are shown and grouped by type.
Figure 2
Figure 2
Sult1a1 KO have a tendency for reduced body weight. (A) Body weight of male wild-type (WT) and Sult1a1 knockout (KO) mice on a standard diet for 14-weeks (n = 11-15 mice at each time point) shown as a percentage of baseline. (B) Body composition of mice 14 and 20 weeks-old on a standard chow diet. (C) 24-hour activity of mice housed in metabolic cages at 14-weeks old. (D) 24-hour food intake of mice housed in metabolic cages at 14-weeks old. (E) EE of mice housed in metabolic cages at 14-weeks old adjusted for body weight as a covariate. EE in units J/h/g. (F) RER of 14-week old chow-fed mice, data represented as the mean ± SEM. A mixed effects model was used to determine effect of genotype (p > 0.05). Data represented as mean ± SD for (B, D), for all other panels the mean ± SEM is shown.
Figure 3
Figure 3
Sult1a1 KO mice are resistant to weight gain and are protected from features of diet induced obesity. (A) Body weight of WT and Sult1a1 KO mice on a HFD for 13-weeks (n = 14-15 mice at each time point). (B) Body composition of 14 and 20-week old mice fed a HFD. (C) Activity shown in unit counts for WT and Sult1a1 KO mice on a HFD for 13-weeks (D) Food intake of mice at 14-weeks old on a HFD during indirect calorimetry (E) EE of mice at 14-weeks old on a HFD during indirect calorimetry. Data adjusted for body weight as a covariate and shown in units J/h/g. (F) RER of mice 14-weeks old on a HFD during indirect calorimetry (G) Fasting plasma insulin levels of 16-week old WT and Sult1a1 KO mice (n = 15 per genotype). (H) Representative image of SR stained eWAT from WT and Sult1a1 KO mice on a HFD for 13 weeks. Open arrowheads indicate collagen deposits. (I) Representative image of hematoxylin and eosin (H & E) stained eWAT from WT and Sult1a1 KO mice on a HFD for 13 weeks. Arrowhead indicates immune cell infiltration and star indicates lysed adipocyte remnants. (J) Quantification of total nuclei in H & E stained images normalized to total area of tissue section. Data represented as mean ± SD for (B, D, G, J); for all other panels mean ± SEM is shown.
Figure 4
Figure 4
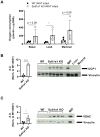
Loss of Sult1a1 increases leak respiration and expression of mitochondrial proteins in iWAT. (A) Higher respiratory capacity in intact subcutaneous adipocytes (iWAT) from Sult1a1 knockout mice (n = 4 mice/group). Basal respiration was measured using pyruvate (5µM) and malate (5µM) as a substrates. Leak respiration was measured by inhibiting ATP synthase with oligomycin (2µg/ml). Titration of FCCP (in 0.5 µM steps) was used to determine maximal respiration. Non-mitochondrial respiration was measured by adding antimycin A (2.5 µM) and subtracted from all other respiratory states. Oxygen consumption was normalized by µg of DNA per chamber. p values were calculated by using the Mann-Whitney test. (B) Quantification of western blot using anti-UCP1 antibody on protein lysates isolated from iWAT analyzed in Figure 4A . Vinculin serves as loading control. First three lanes are WT iWAT lysate followed by four Sult1a1 KO iWAT lysate. The last three lanes are controls; brown adipose tissue (BAT) serves as positive control and expresses UCP1 protein, liver and muscle serve as negative control and do not express UCP1. (C) Quantification of Western blot using anti-VDAC antibody on protein lysates isolated from iWAT analyzed in Figure 2A . Vinculin serves as loading control. First three lanes are WT iWAT lysate followed by four Sult1a1 KO iWAT lysate. The last lane is BAT which serves as positive control for mitochondrial protein expression. p values for both quantifications were calculated using a t-test. Data represented as mean ± SD for all panels.

References

    1. Blüher M. Obesity: global epidemiology and pathogenesis. Nat Rev Endocrinology. (2019) 15:288–98. doi: 10.1038/s41574-019-0176-8 - DOI - PubMed
    1. Sanchis-Gomar F, Lavie CJ, Mehra MR, Henry BM, Lippi G. Obesity and outcomes in COVID-19: when an epidemic and pandemic collide. Mayo Clin Proc. (2020) 95:1445–53. doi: 10.1016/j.mayocp.2020.05.006 - DOI - PMC - PubMed
    1. Anderson J, Konz E, Frederich R, Wood C. Long-term weight-loss maintenance: a meta-analysis of US studies. Am J Clin Nutr. (2001) 74:579–84. doi: 10.1093/ajcn/74.5.579 - DOI - PubMed
    1. Wing RR, Phelan S. Long-term weight loss maintenance. Am J Clin Nutr. (2005) 82:222–5. doi: 10.1093/ajcn/82.1.222S - DOI - PubMed
    1. Wu T, Gao X, Chen M, Van Dam RM. Long-term effectiveness of diet-plus-exercise interventions vs. diet-only interventions for weight loss: A meta-analysis: Obesity Management. Obes Rev. (2009) 10:313–23. doi: 10.1111/j.1467-789X.2008.00547.x - DOI - PubMed