. 2025 Feb;12(6):e2413561.
doi: 10.1002/advs.202413561. Epub 2024 Dec 20.

RUNX2 Phase Separation Mediates Long-Range Regulation Between Osteoporosis-Susceptibility Variant and XCR1 to Promote Osteoblast Differentiation

Affiliations

RUNX2 Phase Separation Mediates Long-Range Regulation Between Osteoporosis-Susceptibility Variant and XCR1 to Promote Osteoblast Differentiation

Yan Zhang et al. Adv Sci (Weinh). 2025 Feb.

Abstract

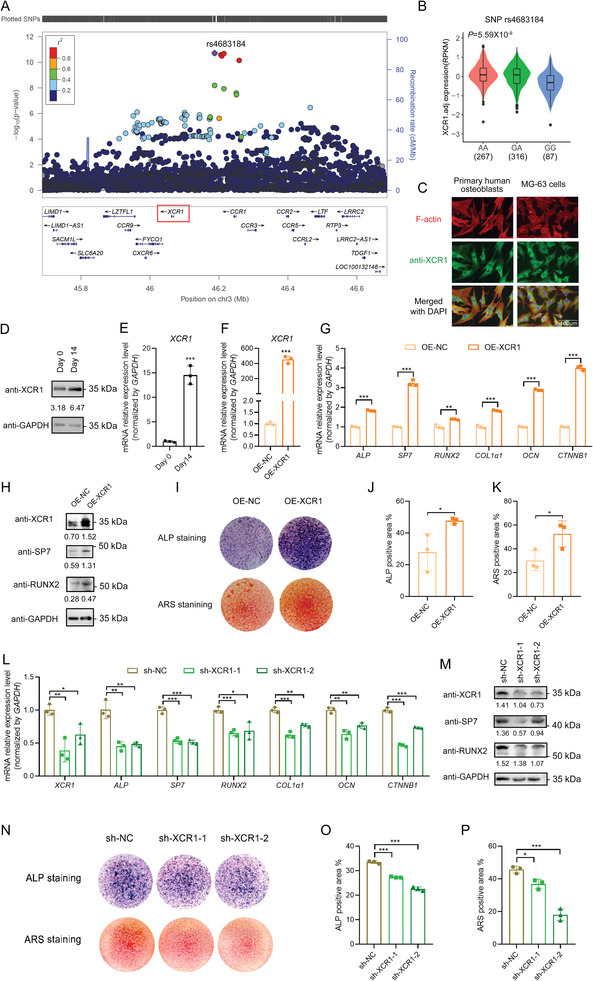
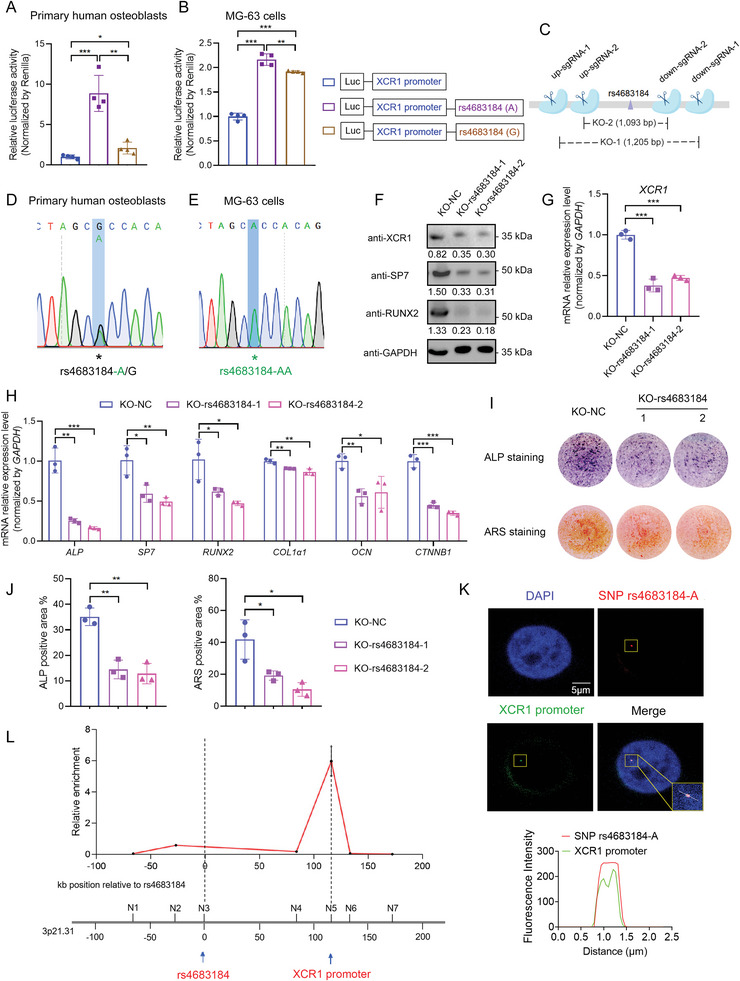
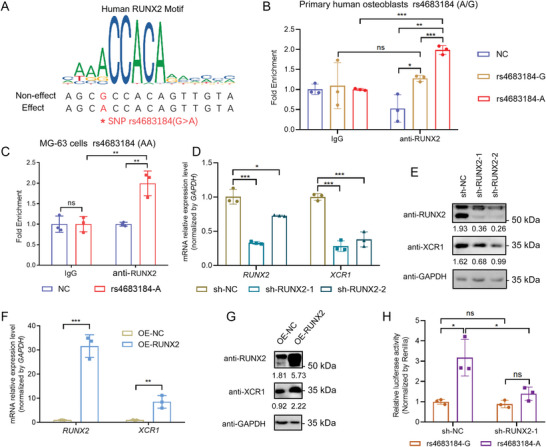
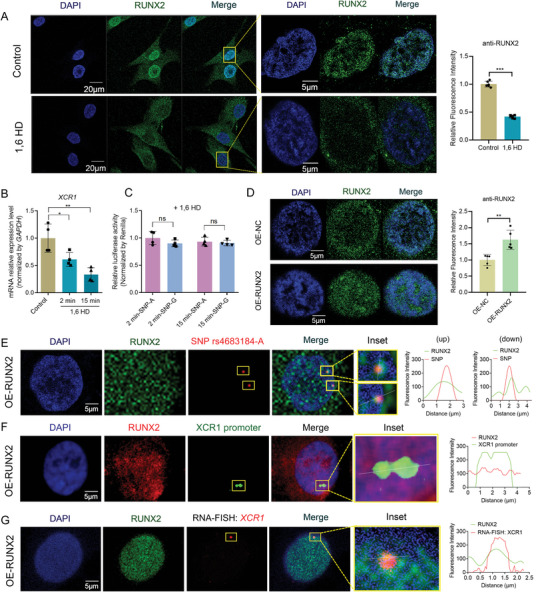
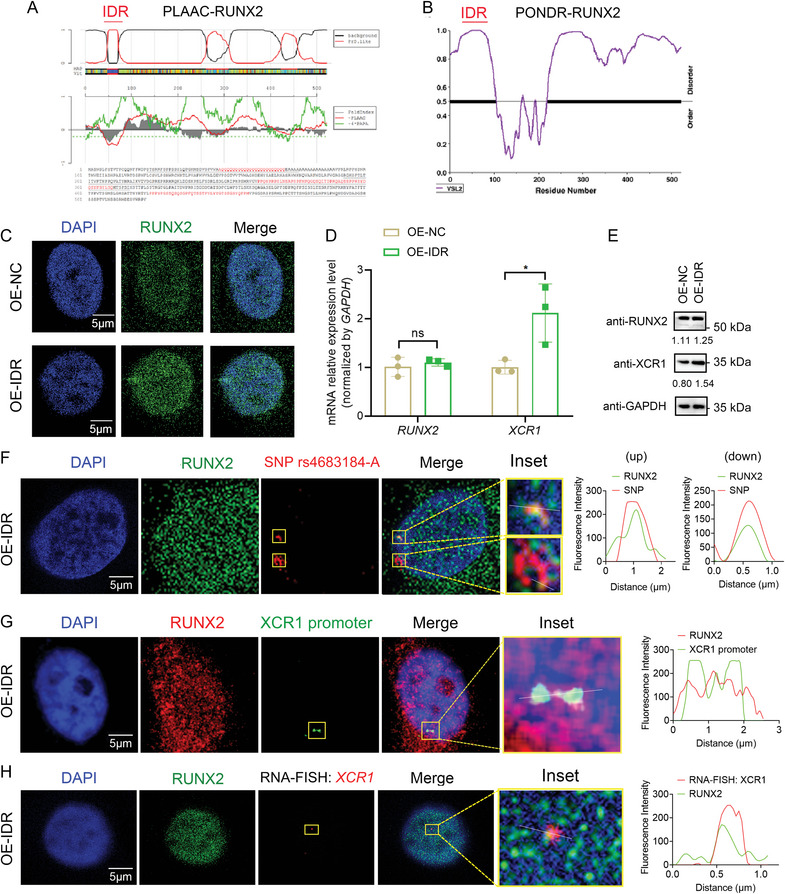
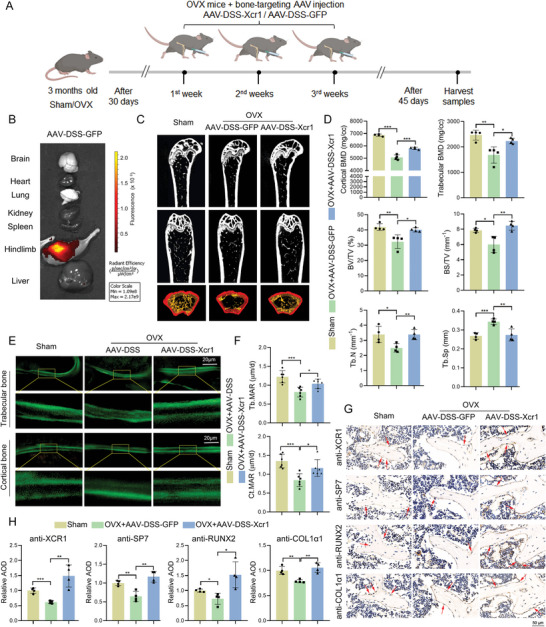
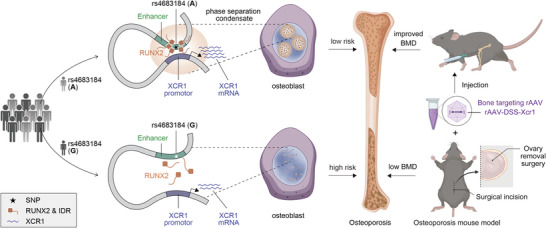
GWASs have identified many loci associated with osteoporosis, but the underlying genetic regulatory mechanisms and the potential drug target need to be explored. Here, a new regulatory mechanism is found that a GWAS intergenic SNP (rs4683184) functions as an enhancer to influence the binding affinity of transcription factor RUNX2, whose phase separation can mediate the long-range chromatin interaction between enhancer and target gene XCR1 (a member of the GPCR family), leading to changes of XCR1 expression and osteoblast differentiation. Bone-targeting AAV of Xcr1 can improve bone formation in osteoporosis mice, suggesting that XCR1 can be a new susceptibility gene for osteoporosis. This study is the first to link non-coding SNP with phase separation, providing a new insight into long-range chromatin regulation mechanisms with susceptibility to complex diseases, and finding a potential target for the development of osteoporosis drugs and corresponding translational research.

Keywords: GWAS; RUNX2; XCR1; osteoporosis; phase separation.


Conflict of interest statement

The authors declare no conflict of interest.

Figures

Figure 1
Figure 1
X‐C motif chemokine receptor 1 (XCR1) significantly promoted osteoblast differentiation. A) Genome‐wide association study (GWAS) identified susceptibility single nucleotide polymorphisms (SNPs) around XCR1 associated with human bone mineral density (BMD). B) Violin plot for XCR1 expression in human whole blood samples with different genotypes of SNP rs4683184 from GTEx V8 (https://www.gtexportal.org/home/). Samples sizes of human whole blood: n (AA) = 267, n (GA) = 316, n (GG) = 87. C) Immunofluorescence (IF) staining of XCR1 in primary human osteoblasts and human osteoblastic line MG‐63. Bar: 100 µm. D) Western blot of XCR1 in MG‐63 cells induced osteoblast differentiation for 14 days. E) RT‐qPCR was used to explore the XCR1 mRNA expression level in induced MG‐63 cells on day 0 and day 14. F,G) XCR1 expression and osteoblast differentiation marker genes Alkaline phosphatase (ALP), Sp7 transcription factor (SP7), RUNX family transcription factor 2 (RUNX2), Collagen type I alpha 1 chain (COL1α1), Osteocalcin (OCN), and Catenin beta 1 (CTNNB1) expressions were detected by RT‐qPCR in control (OE‐NC) and XCR1 overexpression (OE‐XCR1) MG‐63 cells. H) Western blot of XCR1, SP7, and RUNX2 in MG‐63 cells. I) ALP staining and Alizarin red S (ARS) staining in OE‐NC and OE‐XCR1 group cells with induced 14 days. J,K) Quantification of I. L,M) RT‐qPCR and western blot were executed to test the expression of XCR1 and osteoblast differentiation marker genes in control (sh‐NC) and XCR1 knock down (sh‐XCR1) MG‐63 cells. N) ALP staining and ARS staining in sh‐NC and sh‐XCR1 group MG‐63 cells with induced 14 days. O,P) Quantification of N. Values of P was determined with a two‐tailed t‐test. *P < 0.05, **P < 0.01, ***P < 0.001.
Figure 2
Figure 2
Non‐coding SNP rs4683184 remotely regulated the expression of target gene XCR1 in osteoblast differentiation. A,B) Dual luciferase reporter assay for XCR1 promoter containing the region surrounding either rs4683184‐A/‐G, or individual XCR1 promoter in primary human osteoblasts and MG‐63 cells, respectively. Luciferase signals were normalized to Renilla activity. C) The scheme for deleting the region containing rs4683184 by CRISPR/Cas9. D) The genotype of rs4683184 in human primary osteoblast. E) The genotype of rs4683184 in human osteoblast‐like MG‐63 cell line. F) Western blot of XCR1, SP7, and RUNX2 protein expression in control (KO‐NC) and in rs4683184 knockout (KO‐rs4683184) MG‐63 cells. G,H) mRNA expression levels of XCR1 and osteoblast differentiation marker genes ALP, SP7, RUNX2, COL1α1, OCN and CTNNB1 were detected by RT‐qPCR in MG‐63 cells. I) ALP staining and ARS staining in MG‐63 cells were induced for 14 days. J) Quantification of I. K) 3D‐DNA fluorescence in situ hybridization (3D‐DNA FISH) experiments in MG‐63 cells. Plot of fluorescence intensity along the white line from left to right in merged image. Red: the DNA probes containing SNP rs4683184. Green: XCR1 promoter DNA probes. Bar: 5 µm. L) Chromosome conformation capture (3C) in MG‐63 cells. The normalized relative enrichment of interaction between rs4683184 region (N3) and XCR1 promoter region (N5) or other five sites (N1, N2, N4, N6, and N7) are shown. Values of P were determined with a two‐tailed t‐test. *P < 0.05, **P < 0.01, ***P < 0.001.
Figure 3
Figure 3
SNP rs4683184 specifically bound the transcription factor RUNX2 to remotely regulate XCR1 expression in osteoblasts. A) The binding sequences of RUNX2 motif containing SNP rs4683184. B) Chromatin immunoprecipitation (ChIP) qPCR assay detected the binding between RUNX2 and rs4683184 (A/G) in human primary osteoblast. C) ChIP qPCR detected the binding between RUNX2 and rs4683184‐AA in MG‐63 cells. D,E) RT‐qPCR and western blot were implemented to validate the expression of RUNX2 and XCR1 in control (sh‐NC) and RUNX2 knock down (sh‐RUNX2) MG‐63 cells. F,G) RT‐qPCR and western blot were used to examine the expression of RUNX2 and XCR1 in control (OE‐NC) and RUNX2 overexpression (OE‐RUNX2) MG‐63 cells. H) Dual luciferase reporter assay for XCR1 promoter containing the region surrounding either rs4683184‐A/‐G in control (sh‐NC) and RUNX2 knock down (sh‐RUNX2) cells. Luciferase signals were normalized to Renilla activity. Values of P were determined with a two‐tailed t‐test. ns. no significant difference. *P < 0.05, **P < 0.01, ***P < 0.001.
Figure 4
Figure 4
RUNX2 phase separation mediated the remote interaction between SNP rs4683184 and XCR1. A) Immunofluorescence (IF) staining and quantification analysis of RUNX2 in MG‐63 cells. 1.5% 1,6‐hexanediol (1,6 HD) was used to disturb the formation of phase separation condensates in cells. B) RT‐qPCR validated mRNA expression of XCR1 in MG‐63 cells with 1.5% 1,6 HD treatment. C) Dual luciferase reporter assay for XCR1 promoter containing the region surrounding rs4683184‐A/‐G in MG‐63 cells with 1.5% 1,6 HD treatment. Luciferase signals were normalized to Renilla activity. D) IF staining and quantification analysis of RUNX2 showed the presence of numerous RUNX2 condensates in the RUNX2 overexpression (OE‐RUNX2) group, when compared to the control (OE‐NC) MG‐63 cells. Bar: 5 µm. E) IF‐DNA FISH results revealed that the probe binding to SNP rs4683184‐A was localized on condensates of RUNX2 phase separation in OE‐RUNX2 MG‐63 cells. Plot of fluorescence intensity along the white line in merged image. Red: DNA probes containing SNP rs4683184. Green: anti‐RUNX2. Bar: 5 µm. F) The XCR1 promoter was localized on condensates of RUNX2 phase separation in OE‐RUNX2 cells by IF‐DNA FISH. Plot of fluorescence intensity along the white line in merged image. Red: anti‐RUNX2. Green: DNA probes of XCR1 promoter. Bar: 5 µm. G) IF‐RNA FISH results showed that the nascent XCR1 RNA was localized on condensates of RUNX2 phase separation in OE‐RUNX2 cells. Plot of fluorescence intensity along the white line in merged image. Red: intron RNA probes of XCR1. Green: anti‐RUNX2. Bar: 5 µm. Values of P were determined with a two‐tailed t‐test. ns. no significant difference. *P < 0.05, **P < 0.01.
Figure 5
Figure 5
RUNX2‐IDR phase separation affected the transcriptional regulation between SNP rs4683184 and XCR1 in osteoblasts. A,B) The intrinsically disordered region (IDR) sequence of RUNX2 in PLAAC and PONDER. C) IF staining of RUNX2 in MG‐63 cells for control (OE‐NC) and predicted IDR overexpression (OE‐IDR) groups. Bar: 5 µm. D,E) RT‐qPCR and western blot were used to examine the expression of RUNX2 and XCR1 in MG‐63 cells. F) IF‐DNA FISH results revealed that the probe binding to SNP rs4683184‐A was localized on condensates of RUNX2 phase separation in OE‐IDR MG‐63 cells. Plot of fluorescence intensity along the white line in merged image. Red: DNA probes containing SNP rs4683184. Green: anti‐RUNX2. Bar: 5 µm. G) The XCR1 promoter was localized on condensates of RUNX2 phase separation in OE‐IDR cells by IF‐DNA FISH. Plot of fluorescence intensity along the white line in merged image. Red: anti‐RUNX2. Green: DNA probes containing XCR1 promoter. Bar: 5 µm. H) IF‐RNA FISH results showed that the nascent XCR1 RNA was localized on condensates of RUNX2 phase separation in OE‐IDR MG‐63 cells. Plot of fluorescence intensity along the white line in merged image. Red: intron RNA probes of XCR1. Green: anti‐RUNX2. Bar: 5 µm. Values of P were determined with a two‐tailed t‐test. ns. no significant difference. *P < 0.05.
Figure 6
Figure 6
AAV‐DSS‐Xcr1 improved bone formation in osteoporosis mice. A) Schematic display of OVX surgery‐induced osteoporosis and subsequent AAV‐DSS‐Xcr1 treatment workflow. B) GFP expression in the hindlimb of AAV‐DSS‐GFP treatment mice. C,D) Micro‐CT analysis of microstructural bone parameters of the distal femurs including cortical bone BMD, trabecular bone BMD, Tb.N (trabecular number), BV/TV (bone volume/total tissue volume), BS/TV (bone surface/total tissue volume), Tb.Sp (trabecular separation) in different treatment mice group. E) Calcein double labeling images showing bone formation capacity. F) Mineral apposition rate (MAR) of trabecular bone and cortical bone. G) IHC staining of XCR1, SP7, RUNX2, and COL1α1 for mice femurs. H) Quantification analysis of G. The average optical density (AOD) analysis of IHC staining was performed using ImageJ. AOD is ratio of the integral optical density (IOD) to the area. Values of P were determined with a two‐tailed t‐test. *P < 0.05, **P < 0.01, ***P < 0.001.
Figure 7
Figure 7
Proposed long‐range regulation model between osteoporosis susceptibility SNP rs4683184 and XCR1 to promote osteoblast differentiation mediated by RUNX2 phase separation.

Similar articles

References

    1. Ensrud K. E., J. Am. Med. Assoc. 2021, 325, 96.
    1. Salhotra A., Shah H. N., Levi B., Longaker M. T., Nat. Rev. Mol. Cell Biol. 2020, 21, 696. - PMC - PubMed
    1. Lee W. C., Guntur A. R., Long F., Rosen C. J., Endocrine Rev. 2017, 38, 255. - PMC - PubMed
    1. Zhu X., Bai W., Zheng H., Bone Res. 2021, 9, 23. - PMC - PubMed
    1. Mullin B. H., Tickner J., Zhu K., Kenny J., Mullin S., Brown S. J., Dudbridge F., Pavlos N. J., Mocarski E. S., Walsh J. P., Xu J., Wilson S. G., Genome Biol. 2020, 21, 80. - PMC - PubMed

Substances

LinkOut - more resources